Underworld

“The descent to Avernus is easy … but to retrace the step and come out to the upper air, this is the task, this the labour.” — Virgil, Aeneid VI.126–129

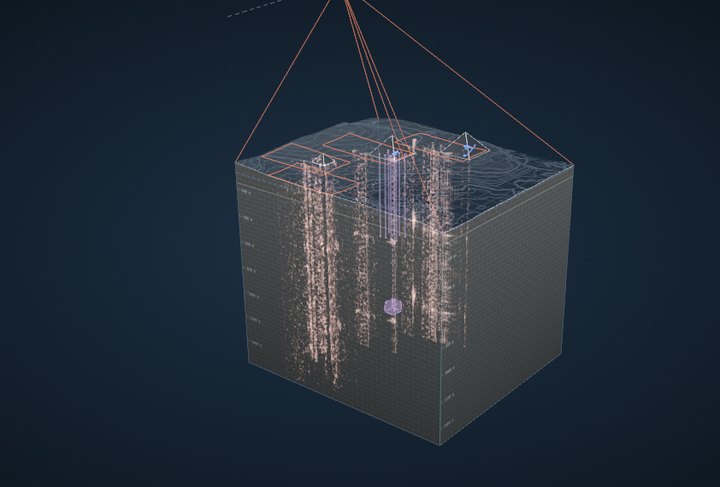
Can one satellite image map the structures claimed beneath Khafre?

Our assessment: no, under the conditions modelled here

In 2025 a team announced an underground city beneath Khafre, mapped from one satellite radar image. We built ground whose contents we know, read it with geophones and with the satellite beside controls, and computed what the claimed structures could leave in one image. The radar methods tested do not show what lies below.

The question readers bring

Can vibration processing of one radar image map the structures claimed beneath Khafre? Our assessment: no, under the conditions modelled here

We modelled representative shafts and a deep chamber at the claimed depths. Their vibration signatures are too weak for reliable recovery, even for an ideal reader given the surface’s reflectivity. Our implementation of the published method also failed to recover the tested layouts when their signals were greatly amplified.

50.031%the best any reading of one image of Khafre could do at saying whether the claimed shafts and void are there, against 50% by guessing, even for a reader given every scatterer’s reflectivity (the 2022 image: 50.065%)P2-38 · a bound over the modelled ensemble, not a measurement on the files
2,100×how much more the claimed structures would have to move the ground before that reader could find them reliably (95% found at 5% false alarms)P2-38 · most favourable specified noise floor
8 of 24layouts our implementation of the published method named correctly, with its stated readout, on simulated images of known ground with the cavities’ effect amplified a thousandfold: chance. A detector given the candidate patterns named 24 of 24P2-37 · blind · 8 grounds · a diagnostic of this implementation

What the assessment rests on

Calculations on a model of the ground, not field measurements: uniform limestone, the trembling measured 67 km away, the radar maker’s most favourable noise figure, representative structures at the claimed depths; the pyramid is omitted, the direction of its effect not established. The physical bound covers every way of reading one image within that model, the published method included; the test of the method itself is of our implementation from the paper, not the authors’ software. The 2022 paper was retracted in August 2026.

What could still change it

Not a louder ground nearby: with the trembling ten times the level measured 67 km away, amplified three times by the site and a cube’s larger moment, the structures are still 96 times short for one image and 46 times for the told reader. What could: a mechanism nobody has yet specified that makes the ground move thousands of times more over a void; a bright fixture over a cavity beside strong shaking, an important unresolved case within the benchmark; or a method shown to find surveyed voids blind, on ground withheld from it. None has been shown.

What we found

Shaken by one vibrator, geophones find the chamber with 11 kN of force; the satellite would need 2 million times more

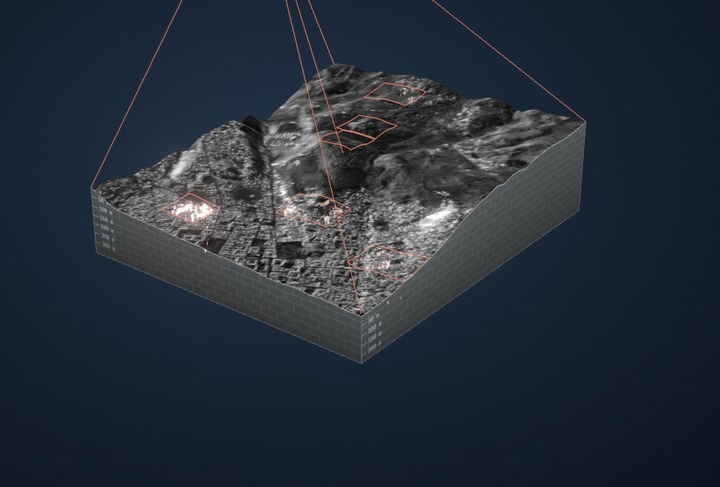
We built ground with a room in it, shook it with a vibrator, and read the same shaking with geophones and with a satellite, giving the satellite every advantage: corner reflectors laid over the room and a detector that already knows both answers. The whole comparison is simulated on the real satellite’s geometry.

1 kN7.6 nm/s1 MN7.6 µm/s1 GN7.6 mm/s1 TN7.6 m/svibrator forceground over the chamberGeophones49 over the chamber, a quiet site11 kNGeophonesthe same, a noisy site1.1 MNSatellite21 corner reflectors laid across it25 GNSatellitenatural groundnothing bright enough to track, at any forceGated reconstructionon the reflectors’ datadoes not read it where the data hold it
One vibrator at the gated method’s own frequency, 30 m from the bench’s chamber, read over the same 24.6 s. Each bar starts at the smallest force at which that reader tells the chamber from no chamber, nine times in ten with one false alarm in a hundred, using a detector that already knows both answers: the best any method could do with those readings. Run whole, the satellite’s chain follows the vibrator where its motion is modest (99% of it recovered at 50 mm/s), but at its bar’s force the reflectors move at up to 0.8 m/s and it keeps 4%: the satellite’s bar is a floor.

The published method, as we implemented it from the paper

Its pictures come from the image and the processing, not from what lies below

  • Over a known room, at the ground’s real shaking, it draws the same picture with the room and without it; so does the stricter version.
  • Its patterns appear in motionless copies of an image and over open ground.
  • Its depth scale is set by the processing (a frequency of the registration), so absolute depth is uncalibrated and repeats. That alone does not decide whether it finds where things are, or their shape: that is tested separately.
  • What it draws across Khafre and Khufu changes from one satellite pass to the next.
  • Where the data demonstrably hold a chamber, shaken hard enough for reflectors to find it, the stricter version still does not read it.

Can an underworld viewer be built?

Yes, with the right instrument for the depth

  • Instruments on the ground find the room: travel times, echoes, whole waveforms, and the vibrator above.
  • Long-wavelength radar reaches about 2 m into the driest sand at L band and 5 m at P band (X band: 30 cm); shuttle radar found buried valleys under the Sahara that way.
  • Many satellite passes measure ground that moves, as over voids that sink or collapse; a stable room in rock moves the ground 182 times less than the ground’s own seasons do.
  • One X-band image of ordinary ground: in our model, however it is read, its rate of finding the room can exceed its rate of false alarms by at most one in 770 million; even beside a bouncing lorry it finds a shallow room, its place or its shape at most 17% of the time at 5% false alarms (step 10, the proof).

The claim

One radar image, reprocessed, said to show a city 600 m underground

The idea is that a single satellite radar image holds the faint vibration of the ground, and that splitting it into sub-apertures turns that vibration into a picture of what lies hundreds of metres below. It was published in 2022, announced beneath Khafre in 2025, and retracted in 2026. Nobody had shown it working on ground whose contents are known.

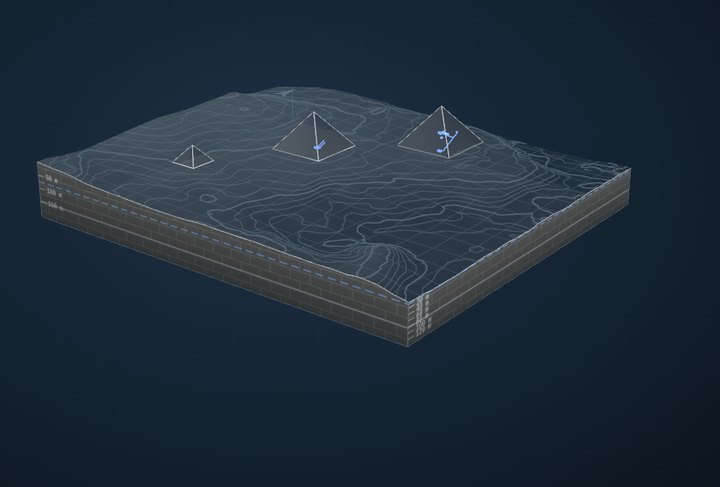
Biondi and Malanga, 2022 (arXiv:2208.00811), retracted by Remote Sensing on 10 August 2026 (notice). The Khafre Project’s briefing in Bologna, 15 March 2025, has not appeared in a peer-reviewed paper; its geometry, as far as it was stated, is drawn below, and in the lab Giza depthsshows it beneath Khafre beside the published-style pictures drawn to the same depths.

0 m500 m1,000 mKhafre, 136 m talleight shafts to 640 ma structure near 1,220 m
The claim to scale, as stated in press accounts of the March 2025 briefing (shaft widths and layout are not published and are drawn as a representative choice). At this scale the X-band radar’s reach, about 30 cm into the driest sand, is thinner than the ground’s line.
  1. Aug 2022The methodBiondi & Malanga: SAR Doppler tomography of the Great Pyramid
  2. Mar 2025The announcementBologna briefing: eight vertical structures beneath Khafre, over 2,000 ft deep
  3. 2025–26ReplicationsThe method reconstructed from its paper, with choices of their own
  4. Aug 2026RetractionRemote Sensing retracts the 2022 paper
  5. Sep 2026This labKnown ground, simulated instruments: seismic first, then the satellite

Step by step

Can one satellite image see beneath the ground?

  1. the ground
  2. its trembling
  3. the chamber’s mark
  4. the satellite’s picture
  5. slices of one picture
  6. the depth pictures
  7. depth is frequency
  8. beside a seismometer
  9. how far off
  10. any way of reading it
  11. could anything change it?

1

We built the ground, so we know exactly what is in it

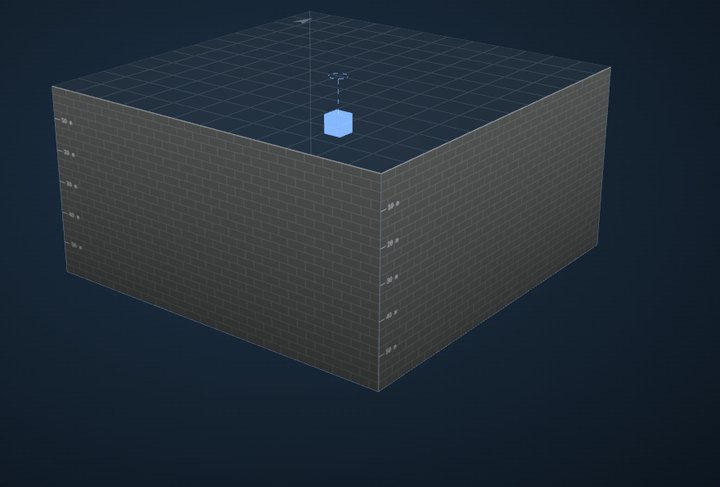
Solid limestone, like the Giza plateau, with one air-filled room in it: 6 metres on each side, its centre 15 metres down. Because we made it, any method’s answer can be checked against the truth.

The one-chamber bench in the labOpen it in the lab, where it turns and every instrument’s picture sits beside the truth →

2

The ground is always trembling, very slightly

Ocean waves thousands of kilometres away keep every continent trembling. Near Giza the ground moves at about 0.049 micrometres per second. At that speed it would take 34 minutes to move the thickness of a sheet of paper, and it never goes anywhere: it only rocks back and forth, a few times a minute. This is the motion the claimed method says it reads.

The ground above the chamber during the satellite’s 24-second pass
-10-50510-0.100.1secondsµm per second

Simulated from the level measured at the nearest open seismometer, 67 km east of Giza. The largest swing here is 0.095 µm/s.

3

In our model, a chamber changes that trembling by one part in 15,000

The waves are kilometres long, so the rock around a room 6 metres wide is squeezed and stretched almost evenly. The room gives a little as they pass, and the ground above it moves a tiny bit differently. We computed how much with the same physics engineers use for rock and steel, and checked it two independent ways. The difference is one part in 15,000 of the trembling: 3.2 × 10⁻⁶ micrometres per second.

The chamber's mark on the ground's motion, seen from above: a small glowing spot over the chamber
10 m
From above · Where the chamber changes the trembling: strongest right over it, fading within about 20 metres. The dashed square is the room.

6.6 × 10⁻⁵

of the ground’s own motion. Even at the most restless places on Earth, the chamber’s signal would be 2.3 × 10⁻⁴ micrometres per second.

A bigger room makes a bigger mark, but a deeper one a smaller mark: it falls with the square of the depth.The structures claimed at Khafre, computed (eight shafts, and a void 80 m across at 1,220 m), leave any reader of the image within 2.4 × 10⁻⁵ of chance under this trembling.

4

What the satellite sees: the surface, grainy, and hardly anything below it

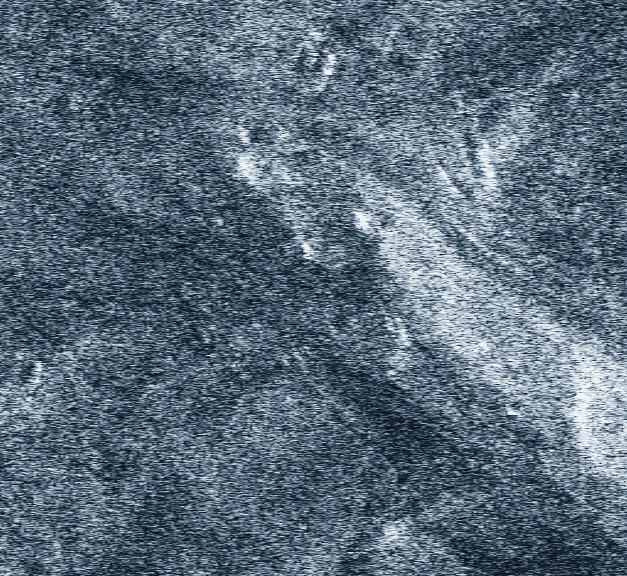
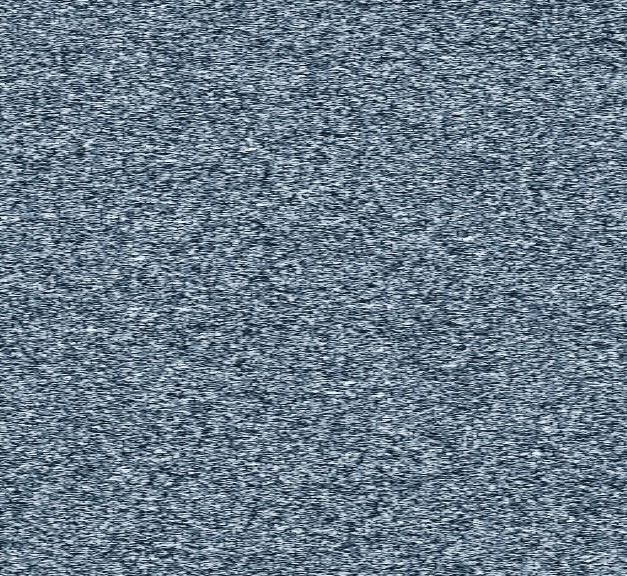
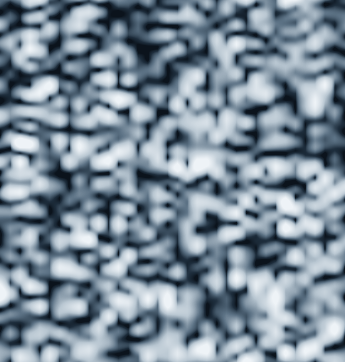
A radar image is not a photograph. Each spot is the echo of countless small reflections interfering, which gives the grainy texture radar people call speckle. The radar’s waves go only a few centimetres into dry rock. On the left is the real ICEYE image of the plateau just south-west of the pyramids; on the right, our simulated ground, flat, with the room 15 metres beneath its centre.

The real satellite image of open plateau near the pyramids
20 m
Real · ICEYE, 27 August 2025: gentle slopes and drifts of sand.
The simulated satellite image of flat ground over a chamber
20 m
Simulated · The same satellite, the same texture. The room is under the middle; nothing shows it.

5

The method cuts one picture into slices and compares them

The satellite takes 24 seconds to make its picture, flying 188 km and seeing the ground from slightly different angles as it goes. The method cuts the picture into slices by the pitch of the echoes: as the satellite passes, every spot’s echo slides steadily down in pitch, like a passing train’s whistle, so each slice is made from one stretch of the pass. It then looks for the ground shifting between them. But the slices come from the same recording. Two slices of nearby moments share most of their data, so they look almost identical (correlation 0.88): comparing something with itself says “nothing moved”. Two slices seconds apart share none, and the grainy texture looks completely different from each angle (correlation 0.06): there is nothing to line up.

A slice of the picture
5 m
A slice
A slice an eighth of a second later: almost identical
5 m
⅛ s later · the same data, almost
A slice one second before the middle
5 m
1 s before
A slice one second after the middle: unrelated texture
5 m
1 s after · unrelated texture
We made a patch of the real image sway at 2 mm/s. What the method reads:
the sway we put inthe method’s reading
-0.500.5-1,00001,000secondsµm per second

It recovers 1% of the motion, though the motion is in the data: read against a copy of the same image left still, which only a simulation has, it all comes back.

6

Its depth pictures are the same with the chamber and without it

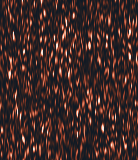
Finally the method turns its readings into pictures of depth, like the ones published for Khafre. Here are its pictures of a slice down through our ground, straight through the room, processed exactly as published. With the room, and without: the same picture. The room changes the satellite’s image by 1 × 10⁻¹⁰ of itself, and the depth picture by 1 × 10⁻⁸. The streaks are the method’s own texture, and they look like structure anywhere. Multiply the room’s effect 10 billion times and the picture does change, but evenly at every depth (0.68 to 1.3 times its average): nothing marks the room.

The method's depth picture with the chamber
0 m13.4 m
along the ground, 90 m
With the room
The method's depth picture without the chamber: the same
0 m13.4 m
along the ground, 90 m
Without the room
The difference between the two: nothing
0 m13.4 m
along the ground, 90 m
The difference

7

What it calls depth is set by how fast the ground moves: an uncalibrated scale, not by itself a useless one

The method’s depth scale is a frequency scale in disguise: a slow wobble comes out shallow and a fast one deep, 6.8 metres for every wobble per second, whatever lies below, repeating further down. Give it the exact motion of the ground, which it never has, and it draws the trembling at the same depth over our room, over a room twice as deep and over solid rock, but brighter where the ground moves more. So absolute depth is ambiguous and uncalibrated; changing the method’s sound wavelength stretches the whole scale without changing the fit. That does not show that where something is, or its outline, is lost: a method that found the right layout at the wrong depth would still be a major success. So that was tested on its own: a room, an L-shaped and a branching tunnel, their marks on the ground amplified until a detector told the shaking named every one and placed it within 0.6 m. The method’s picture, read blind, named 4 of 9, where guessing names 3 on average, and did not place them better than empty ground (the shape test, and five claims scored apart).

Where the method puts motion of each speed
the rulethe method
00.511.522.530510wobbles per secondmetres of “depth”

Past 2 wobbles a second the scale folds back. Giza’s ground rings at 0.6 a second, which the method would draw at 4.1 m; Khufu’s pyramid sways at 2.3, drawn at 11.6 m.

8

Beside a seismometer, the satellite’s reading is mostly noise

Put a seismometer on the ground over the room, and read the same spot from the satellite as the method does. The seismometer follows the trembling. The satellite’s readings scatter 10,000 times more widely, and not with it: at the scale of its readings, the ground’s real motion is the flat line along zero.

The same spot, two instruments, the middle two seconds of the pass
seismometersatellite, as the method reads it
-1-0.500.51-5000500secondsµm per second

The seismometer’s trace swings by 0.04 µm/s; the satellite’s readings scatter by 398 µm/s.

9

In our model, the chamber’s signal is three hundred million times too faint

Everything on one scale, each step ten times the last. On the left, how fast things actually move; on the right, the smallest motion one satellite pass could detect, allowing it every advantage. The chamber’s signal and the satellite’s reach are eight steps apart on plain ground: like trying to see a change the thickness of a sheet of paper on something taller than Mount Everest.

10−610−510−410−310−210−1100101102103104micrometres per secondthe chamber’s signal3.2 × 10−6 µm/s · at Gizathe chamber’s signal2.3 × 10−4 µm/s · noisiest place on EarthGiza’s ground, trembling0.049 µm/s · measured nearbythe most restless ground3.5 µm/s · on Earthwhat a person can just feel45 µm/sa metal reflector6.2 µm/s · placed on purposea bright stone62 µm/splain ground900 µm/sthe gap

10

In our model, however one image is read, it cannot reliably find a room: one in 770 million better than chance under the ground’s own trembling, and at most 17% found beside a bouncing lorry

Steps 5 to 9 tested one method. This step bounds every method at once, including any not yet invented, within a stated model. An image is made of three things: the echo from what the radar reaches, a few centimetres into the ground; the surface itself; and how the surface moves during the 25-second pass. The room is 15 metres down, far past the echo, so only the motion can carry it; and processing can lose what the image holds, never add to it.

How much does the motion leave? Radar texture is random, like the grain of film. When the whole scene moves together, the grain stays exactly as random as it was, and the image keeps no trace of that motion: not a little, none. What leaves a trace is ground moving differently from place to place, which stretches the texture along the satellite’s track. Over the room that stretch is at most 6 × 10⁻¹¹, and in our model it caps what any method can do: raise its rate of finding the room above its rate of false alarms by at most one in 770 million (with room and no room equally likely, be right half that much more often than a coin toss). At the most restless places on Earth, one in 11 million.

A lorry shakes the ground far harder, and faster, and a shallow room scatters that more. So we built one fully specified comparison: rooms 6 and 10 metres across under a roof only 5 metres thick, an L-shaped tunnel, the same room 6 metres over, and empty ground, identical but for the cavity, with a lorry bouncing over a bump 15 metres away for the whole pass and the wave the room scatters carried undiminished to the edge of the image. Even then, reading the one image, no method can find the room more than 17% of the time at 5% false alarms, nor tell where it is or which shape it has any better. A detector handed the exact texture of the ground as well, which no single image gives, stays below 47% even at the lowest noise the satellite’s maker specifies (18 decibels below the ground’s measured echo; the images carry no noise figure of their own); its bound stops ruling out a reliable detection only at 28 decibels. What stays open is what this model leaves out: two images, bright fixtures on the ground, and mechanisms nobody has yet specified well enough to compute.

belowThe room6 m across, its roof 5 m down, a lorry 15 m away (the benchmark’s world WA)
Its echoX-band waves reach about 30 cm into the driest sand; the room’s roof lies at least 145 dB downnoted, not pursued
The surfacewhat any photograph shows: the ground itself, not what is under itno view below
How the surface moves in the 25 s passthe room changes how the ground moves under the lorry’s wave and the trembling (computed); in speckle, motion shared by the whole scene leaves no trace in the texture; only motion that differs from place to place leaves anyfound ≤ false alarms + 4.2% (P2-36)
recordedOne imagegrainy texture: the echo of countless small reflections
processedAny methoda function of the image: it can lose what the image holds, never add to it
10⁻⁹10⁻⁶10⁻³1a reliable detectiondetection rate − false-alarm rate, at most →Giza’s tremblingthe regional microseisms, 67 km east1.3×10⁻⁹The most restless ground on Earththe noisiest stations, 72× that level9.3×10⁻⁸Faster trembling1–3 and 3–8 Hz, the regional levels2.8×10⁻⁸A city’s traffic humurban background, all pass; the oracle8.3×10⁻³A lorry over a bump, 15 m awayall 25 s, worst sampled side; the oracle0.12The same, one image, any readerrooms under a 5 m roof; the benchmark, worst frequency0.12The structures claimed under Khafreeight shafts, a void at 1,220 m; computed, any reader2.4×10⁻⁵
For each source of shaking, the most that any way of reading one image of ordinary ground can raise its rate of finding the chamber above its rate of false alarms, within the model: ordinary ground as fully developed speckle, the chamber’s imprint as the lab’s solver finds it, the method told the shaking exactly and the image without receiver noise (both only raise the ceiling). With the two cases equally likely, the best accuracy exceeds a coin toss by half this. A reliable detection, 95% found with 5% false alarms, needs 0.9; at every operating point found ≤ false alarms + this. A bound, not what a detector reaches: on small test images the best detector gets within1.4 times of it. The traffic and lorry rows are the oracle’s (P2-29: told the texture and the shaking, receiver noise at the most favourable specified level, 18 dB per cell), because under strong shaking the ground without a chamber already moves with the lorry and a whole-image speckle bound’s reference would leave that out; the scattered wave is carried undiminished across the scene. The row below them is the benchmark’s (P2-36): a room under a 5 m roof, any reader of the one image, bounded line by line with the lorry’s wave in each line’s reference, the largest over presence, a 6 m location and shape and over the sampled band.

The proof, finite and stated, in three layers → · every case and check →

11

Could anything change the answer?

What if the ground shook harder?

At the most restless places on Earth the ground moves 70 times more than at Giza’s regional level, and in our model no way of reading the image raises its rate of finding the room above its false alarms by more than one in 11 million (step 10). A lorry close by shakes the ground far harder, and faster, which the room scatters more; yet with a lorry bouncing over a bump 15 metres from a room under a 5-metre roof for the whole pass, one image still lets no method find the room more than 17% of the time at 5% false alarms (step 10); a detector told the ground’s exact texture as well, at the lowest noise the satellite’s maker specifies, gains at most 0.12 for the deeper bench room, even if the wave the room scatters carries undiminished across the scene. A detection would need the room itself to add at least 47 micrometres of motion to the ground over it as a smooth mound, or as much summed over the ground in some other pattern. The method’s own slices fare worse: one short enough to follow such shaking blurs the ground over 30 metres.

What about a shinier target?

A lone bright point is the satellite’s best case: it can follow a bright stone’s motion, even a metal reflector placed on purpose. The chamber’s signal under such a point is still 19 million times too faint for a stone and 2 million for a reflector.

What about a cleverer way to read the image?

That is step 10: it bounds every way of reading one image at once, within a model. For ordinary ground, as radar texture is modelled, motion shared by the whole scene leaves the texture’s statistics unchanged, and what survives of the room’s mark lets no method, however clever, raise its rate of finding the room above its false alarms by more than one in 770 million; on small test images the best possible detector comes within 1.4 times of that bound. Bright points can be tracked, and a corner reflector over the room raises the cap only to 2 × 10⁻⁷. What the model leaves out (the echo at longer wavelengths, reflectivity changing during the pass, many images) is listed with the bound. The bound, derived and checked.

What if the room works nonlinearly, or shifts the phase of the ground’s vibration without a new tone?

Our solver is linear, so it cannot rule out an unspecified nonlinear or parametric mechanism. But any mechanism, linear or not, reaches the image only through the motion it adds to the ground over the room, and step 10’s requirement counts that motion whatever made it, summed over the ground, whatever its pattern. A change of phase alone, of any size, moves the ground by at most twice the vibration it acts on, so such a mechanism is ruled out only while the ground whose phase it changes, at the full doubling, stays smaller than about 860 thousand square metres (a disc 523 m in radius) at Giza’s regional levels: a condition any such mechanism must meet, not a sign that one does. A mechanism would have to show its phase changes reach that far, or have gain, drawing energy together over the room for the whole pass, and it would have to be specified well enough to compute before it could be tested.

Then why do the published pictures look so convincing?

Because the method draws such pictures from any image: over our flat simulated ground, with and without a room; over open desert on the real image; over hundreds of surveyed tombs at Giza, where it found none. Its tall columns are pixels whose reading wanders, drawn bright at every depth. Settings the paper does not state finish the look: neighbouring pixels sharing their shifts line its bands up into rungs, and pairs taken close together in the band draw a bright block where its depth scale repeats. See them under every pyramid and open plateau alike, or how the pillars, rungs and blocks are made.

What about stricter versions that filter out the noise?

Later versions keep only readings that pass a row of tests. We ran the public one, Replication and Verification of the Biondi Protocol (v1.8 standalone package), unchanged. On the repository’s own line in front of the Sphinx it reproduces the published picture (7 of our 8 columns where its figure has them), and moving that line by one pixel loses 2 to 5 of them. Motionless copies of the image pass its tests too; across the pyramids it passes about one position in 8, as over open plateau; over our known room its picture changes no more with the room than with random noise of the room’s size; and across Khafre and Khufu what it draws, and at what depth, does not survive a change from one satellite pass to another. The gates, measured; the Sphinx line.

Hasn’t vibration been measured from space?

Yes, and we agree it can be. In 2026 two teams measured metal reflectors on shakers and a steel footbridge moving about a millimetre per second, checked against instruments on the ground. That is what radar does well: a bright point moving a lot. Ordinary ground trembles thirteen thousand times less at Giza, and one picture barely registers it.

Instruments on the ground find the room. Why doesn’t the satellite?

Because the ones that find it make their own waves. A hammer blow sends a short, sharp wave, about fifteen metres long, whose timing is known exactly; instruments pressed against the ground catch its echo from the room. The satellite has no hammer, listens for 25 seconds, and barely registers ordinary ground’s trembling.

Isn’t this only a simulation?

Each step is checked on the real satellite image. The real image’s own numbers reproduce the method’s “coherence” exactly; a patch of the real image made to sway is nearly invisible to the method’s reading (1%). The chamber’s mark and how far off it is are models, and only as good as the models are; none of it has yet been checked against ground motion measured on the plateau during a pass. What would settle it.

What does work: instruments that touch the ground

The same room, in the same simulated ground, is found by sound sent between boreholes, by the echo of a hammer blow imaged from the surface, and by fitting whole recorded waveforms. What the satellite lacks is not cleverness but contact: it sees the surface, and the surface barely feels the room.

chamber · 6 m · 12 m down12345schematic · not to scale
1Crosshole travel timessparker and hydrophones down four boreholes9 mrecoveredchamber recovered as a -11% shadow, 3.5× the scatter
2Surface travel timeshammer grid over a geophone grid12 msees nothingnothing (+0%): no first arrival reaches the chamber
3Echo imagingthe same surface records, the chamber’s scattered wave migrated back12 mrecoveredlit at the chamber, 6× the image elsewhere, with the rock known exactly
4Ambient noisethe same geophones listening to footsteps and traffic, no hammer12 mfaintretrieves the wave (correlation 0.90), but the image tops out at 2.2× at any record length
5Satellite radaran ICEYE dwell, 24.5 s of aperture, 600 km up607 kmsees nothingblind to the ground moving (1% recovered), and the chamber’s imprint lies 10⁸ times below what it could detect

The lab

A lab for looking underground: known ground, every instrument, every method, and why each draws what it draws

Every site is a block diagram you can turn, cut and play waves through. Look at the ground as it is, or look with an instrument: geophones on the ground (travel times, echoes, ambient noise, full waveforms, and the waves they record), or the satellite overhead, read by the paper-style pipeline and by a stricter gated reconstruction run unchanged. Each method’s picture sits one click from its controls, with a note on why it draws the pillars, bands and columns it draws. Simulated passes and synthetic products run through the same code as the real images, and every run records the command that repeats it.