From orbit · what one radar image can show, and what it has not
The satellite over the same ground
Can one satellite radar image show chambers under the ground, as claimed under Khafre? The real ICEYE passes over Giza are simulated over ground whose contents are known, and the published method and a stricter reconstruction of it are run on real and simulated images beside controls. The methods tested do not show chambers, and computed for the claim’s own structures, no way of reading one image could; single images can still measure strong vibration of bright targets. Where this rests on models, and what would test it, is set out below.
status · tested, not closed · 1 October 2026 · revised after each independent review
The question readers bring
Can vibration processing of one radar image map the structures claimed beneath Khafre? Our assessment: no, under the conditions modelled here
We modelled representative shafts and a deep chamber at the claimed depths. Their vibration signatures are too weak for reliable recovery, even for an ideal reader given the surface’s reflectivity. Our implementation of the published method also failed to recover the tested layouts when their signals were greatly amplified.
What the assessment rests on
Calculations on a model of the ground, not field measurements: uniform limestone, the trembling measured 67 km away, the radar maker’s most favourable noise figure, representative structures at the claimed depths; the pyramid is omitted, the direction of its effect not established. The physical bound covers every way of reading one image within that model, the published method included; the test of the method itself is of our implementation from the paper, not the authors’ software. The 2022 paper was retracted in August 2026.
What could still change it
Not a louder ground nearby: with the trembling ten times the level measured 67 km away, amplified three times by the site and a cube’s larger moment, the structures are still 96 times short for one image and 46 times for the told reader. What could: a mechanism nobody has yet specified that makes the ground move thousands of times more over a void; a bright fixture over a cavity beside strong shaking, an important unresolved case within the benchmark; or a method shown to find surveyed voids blind, on ground withheld from it. None has been shown.
The proof, finite and stated → · every test, on the satellite page →
The methods tested here do not show chambers; read from one shaking, the satellite needs 2 million times the force geophones need
The first is a property of the processing and holds whatever the ground does: the published depth coordinate is the frequency of each pixel’s registration series, and nothing yet supplied turns it into a physical depth; that would take a model linking a buried object to the surface’s motion and to the radar’s reading, tested on known voids. The second is measured, for complex correlation between one image’s lookslook radarAn image formed from part of the Doppler band. In a dwell the band is time, so a look sees the ground as it was during a few seconds, and averages any motion over them. on real texture; bright points can be tracked, and any other estimator needs its own measurement. The third and fourth rest on models: a small chamber in uniform rock, shaken at Giza’s regional microseism level. Resonance, layering, larger structures or other forcing would change their numbers, though the gaps they find are wide. The fifth is of another kind: a bound on every way of reading one image of ordinary ground at once, tested or not, within a stated model (P2-25, below); its inputs are those same models, extended by P2-26 to every frequency, and P2-27 turns it into the room-specific motion a detection would need. None of this shows that no radar could ever sense anything below the surface; it shows that these methods, as tested, do not, and that within the model no other way of reading one X-band image of ordinary ground could do much better. None of it has yet been checked against measured ground motion and radar data taken together. The measured record from the real acquisitions (the first investigation) agrees, and several of its readings, and of ours, are corrected below.
The stricter, gated reconstruction throughout is the public Replication and Verification of the Biondi Protocol(v1.8 standalone package, commit ac6f2500), run unchanged: its source and profile hash to 3e1154c11274… and ae84cade31f7…, as every run’s record states.
Within its model, one image of ordinary ground holds almost nothing of the chamber: under Giza’s regional microseism level no test’s detection rate can exceed its false-alarm rate by more than 1.3 × 10⁻⁹, and beside a bouncing lorry none finds a shallow room more than 17% of the time at 5% false alarms
Everything above tests methods by running them. This bounds them all at once, including methods not yet written, within a stated measurement model (P2-25). An image is made of the echo from what the radar wave reaches, the surface, and the surface’s motion during the pass; any method is a function of the image, so none can hold more about the chamber than the image does (the data-processing inequality). The echo is noted, not pursued: the bench chamber’s roof lies at least 347 dB down at X band (P2-11). The surface is what any photograph shows. The motion is bounded here, generously: the method is told the ambient shaking exactly, the image has no receiver noise, and the rock no attenuation; each only raises the bound. The model: ordinary ground as fully developed speckle with no reference image, the chamber’s imprint as the lab’s elastic solver finds it, and the image formed by the Doppler-to-time relation (checked below against pulse-by-pulse physics).
The theorems, the benchmark (five worlds identical but for the cavity, a lorry beside each, bounded line by line), the loose certificate and the oracle are set out together on the proof page; this section holds the tight calculation, its checks and every case.
The bound
For any test, detection rate − false-alarm rate ≤ TV ≤ min(√(KL/2), √(1 − e−KL)) (Pinsker, Bretagnolle–Huber); with the two cases equally likely, the best accuracy is ½ + TV/2. Ordinary ground is specklespeckle radarThe grainy texture of radar images of natural ground: many small scatterers in each cell interfering. Each Doppler bin holds an independent speckle pattern.: the image is a zero-mean circular Gaussian vector, and the change from no chamber to the chamber is bounded exactly, not to first order: whitening the covariance change into E, KL ≤ ‖E‖²/(2(1 − ‖E‖)) with ‖E‖ ≤ √F + ε, F the Fisher informationFisher information seismic · radarHow sharply the probability of the data changes with a parameter. Its inverse bounds the variance of any unbiased estimate (the Cramér–Rao bound), and for a small change it sets, to first order, how well any test can tell the two cases apart; for a finite change it bounds that with an explicit remainder. and ε an explicit remainder (a power series in the imprint’s phase). With the spectrum’s bins independent
F = Σf, f′ |Φ̃(f − f′; f) − Φ̃(f − f′; f′)|²
Φ̃(k; f) is the spatial Fourier coefficient at k of the imprint’s radar phase 4πd/λ at the slow time t = fa/Ka at which the pass sees Doppler bin f, over the processed band. For a weak signal the best test reaches 2Φ(√F/2) − 1 ≈ 0.40√F; the bound allows 0.50√F.
What survives of motion in speckle
- Motion shared by the scene holds nothing. Φ̃ is then nonzero only at k = 0, where the difference vanishes: F = 0 exactly, not approximately.
- Any motion: F ≤ 4N⟨Φ²⟩, N the independent resolution cells (28 per square metre here) and ⟨Φ²⟩ the imprint’s mean-square phase over them and over the pass.
- Slow, smooth motion: F = (R/Vs)² Σcells ⟨(∂v/∂x)²⟩. The texture is stretched along track by the line-of-sight velocity’s gradient times R/Vs (79.3 s at Giza), and only that stretch survives. Faster motion displaces faint copies of the texture by 1.24 m per hertz, and where they land on ground that moved differently they leave a trace too; the exact sum counts both.
Checked: the sums, the finite change, detection apart from estimation, and the model’s time relation
| check | result |
|---|---|
| The double sum against tr(C⁺C′C⁺C′) built scatterer by scatterer (a 32 × 8 image) | agree to 6 × 10⁻¹⁶ |
| Motion shared by the whole scene | F = 0; the score’s value 6.0 × 10⁻¹⁴ (zero to rounding) |
| The exact form on the image’s own pixels (every case below) against the double sum | agree to 8 × 10⁻¹⁴ |
| The finite change: exact KL (the covariance’s eigenvalues, a 128 × 16 image, peak phase to 0.8 rad) against F/2 and the rigorous bound | exact KL up to 1.006 × F/2; the bound holds in every case, vacuous in 5 of 12 (phase large enough that the remainder passes one) |
| Detection, 4,000 images each way, deflection 0.5: the exact likelihood-ratio test’s largest detection − false alarm, and the score test’s | 0.196 and 0.193 (± 0.022); weak-signal theory 0.197; Pinsker from the exact KL 0.250, 1.28 times the likelihood-ratio test |
| Detection, 4,000 images each way, deflection 1.5: the exact likelihood-ratio test’s largest detection − false alarm, and the score test’s | 0.538 and 0.515 (± 0.022); weak-signal theory 0.547; Pinsker from the exact KL 0.749, 1.39 times the likelihood-ratio test |
| Estimation, separately: the score on 600 speckle images, a 1.5 m imprint at 2 Hz boosted to 0.10 rad: its spread without, its shift with, against √F and aF | 1.01 ± 0.03 and 1.00 ± 0.06; its estimate’s variance 0.94 of the Cramér–Rao bound |
| The same, on the lab’s synthesizer: 80 scenes of scatterers at random, moved through its own motion callback | 0.96 ± 0.08 and 1.00 ± 0.01 |
| The stretch regime (a 8 m imprint at 2 Hz, where the chamber’s microseism imprint lives), 600 images | 1.03 ± 0.03 and 0.89 ± 0.07 |
| The model’s Doppler-to-time relation against pulse-by-pulse physics: a 0.5 s aperture at the real chirp rate, 5 to 150 Hz; five cycles across the aperture as the time-bandwidth product grows | the same information to 3.6% (1.47 times more in the model at 0.5 Hz, a quarter cycle); the model’s excess 6.1% falling to 0.07% by 6.4 × 10⁴ (the real dwell’s: 3.4 × 10⁶): an edge effect, on the side of more information |
| P2-04’s static kernels, recomputed, against its published map | largest difference 2.1 × 10⁻⁶ of the peak |
The chamber on the real Giza dwell, for every kind of shaking
| shaking | level | F | detection − false alarm, at most | accuracy over a coin toss, at most |
|---|---|---|---|---|
| Giza microseisms, measured (static imprint, P2-04) | 0.049 µm/s rms, 0.2 Hz | 6.7 × 10⁻¹⁸ | 1.3 × 10⁻⁹ | 6.5 × 10⁻¹⁰ |
| The world's noisiest stations (static imprint, P2-04) | 3.5 µm/s rms, 0.2 Hz | 3.5 × 10⁻¹⁴ | 9.3 × 10⁻⁸ | 4.7 × 10⁻⁸ |
| Giza 1-3 Hz, measured (static imprint, P2-04) | 0.029 µm/s rms, 2 Hz | 7.3 × 10⁻¹⁶ | 1.3 × 10⁻⁸ | 6.7 × 10⁻⁹ |
| Giza 3-8 Hz, measured (static imprint, P2-04) | 0.025 µm/s rms, 5 Hz | 3.1 × 10⁻¹⁵ | 2.8 × 10⁻⁸ | 1.4 × 10⁻⁸ |
| Urban background, 8–100 Hz, the whole pass (dynamic imprint, P2-26; a surrogate, the reference lacking the traffic’s own motion) | 9 µm/s rms | 9.2 × 10⁻⁶ | 1.6 × 10⁻³ | 7.8 × 10⁻⁴ |
| A truck over a bump 15 m away, the whole pass, at the worst frequency (52 Hz) and sampled side (a surrogate, likewise) | 100 µm/s rms | 1.9 × 10⁻³ | 0.023 | 0.011 |
| The same two, a room 10 m across whose roof is 5 m down (surrogates) | 2.3 × 10⁻⁴ · 0.045 | 9.0 × 10⁻³ · 0.12 | 4.5 × 10⁻³ · 0.06 | |
| A point 12 dB over the clutter on the imprint’s peak (the brightest point on open plateau), microseisms | 3.8 × 10⁻¹⁷ | 3.1 × 10⁻⁹ | 1.5 × 10⁻⁹ | |
| A point 12 dB over the clutter on the imprint’s peak (the brightest point on open plateau), truck over a bump, 15 m | 9.4 × 10⁻⁹ | 4.8 × 10⁻⁵ | 2.4 × 10⁻⁵ | |
| A point 50 dB over the clutter on the imprint’s peak (a corner reflector), microseisms | 2.3 × 10⁻¹³ | 2.4 × 10⁻⁷ | 1.2 × 10⁻⁷ | |
| A point 50 dB over the clutter on the imprint’s peak (a corner reflector), truck over a bump, 15 m | 5.6 × 10⁻⁵ | 3.8 × 10⁻³ | 1.9 × 10⁻³ | |
| Told the ground’s reflectivity (a genie: no single image has it), every pixel at the most favourable specified signal-to-noise ratio (18 dB): Giza’s microseisms | 1.0 × 10⁻¹² | 5.0 × 10⁻⁷ | 2.5 × 10⁻⁷ | |
| Told the ground’s reflectivity (a genie: no single image has it), every pixel at the most favourable specified signal-to-noise ratio (18 dB): the truck, all pass | 0.07 | 0.13 | 0.066 | |
| The claimed deep structure, 80 m at 1,220 m, Giza’s microseisms (an estimate by P2-04’s scaling here; computed with the shafts in P2-38, on the proof page) | 8.6 × 10⁻¹⁹ | 4.6 × 10⁻¹⁰ | 2.3 × 10⁻¹⁰ |
The ambient levels are the regional ones: the microseisms and the 1–3 and 3–8 Hz levels measured at Kottamya, 67 km east (M1-01), with Peterson’s noisiest stations above them. The level at the pyramids, with their own traffic and visitors, is unmeasured, and none of these is an upper limit there; the urban and truck rows stand in for louder ground.
What one image would need: for every pattern, a large enough displacement integral over the ground; for a smooth pattern, at least 3 mm at microseism frequencies or 47 µm at 80 Hz
P2-27, on the Giza dwell of 27 August 2025. Solid: exact within the model for one smooth pattern (each line of the image’s KL from its covariance’s determinant, the range band widened, which can only add information); dashed: linearised, beyond the exact computation. Dotted: every pattern and time history, by the displacement integral (the oracle, valid under any shaking), as the temporal peak of a motion filling the footprint evenly. Points: the bench room’s modelled imprints, 8.3 × 10⁸ below the smooth-pattern curve under the regional microseism level and 4.6 × 10⁵ short of the every-pattern requirement; under a truck over a bump 15 m away 140 to 1.1 × 10³ below the smooth-pattern curve, and against the every-pattern requirement, its scattered wave carried to the scene’s corner, 1.7 to 15.
A requirement curve for one family of patterns, and a displacement-integral requirement for all
The bound turned around: how large must the motion the room itself adds to the ground be before any way of reading one image could find it? For the Giza dwell, ordinary ground as fully developed speckle with no reference image and no receiver noise, one smooth room-specific pattern (a Gaussian) coherent for the whole pass at its worst phase, and a target of 95% found with 5% false alarms: at least 3 mm of line-of-sight motion at 0.2 Hz (where only its gradient counts) and 47 µm at 80 Hz over 279 m². The exact computation stays within 5.1% of its quadratic start even at those amplitudes.
That curve is for that family only. What the image holds depends on the pattern as well as its size: the same Gaussian multiplied by a cosine of 4 m period along track holds 39 times its information at 0.2 Hz, though nowhere larger (an independent review’s example, reproduced), and the Gaussian’s information is 4.7 × 10⁻⁴ of the general upper bound for its envelope (a bound, not an attainable optimum). For every pattern the requirement is on the displacement integral ∫ maxt|Δu|² dA (m⁴, an integrated squared displacement envelope, not an energy; the proof): an oracle told the reflectivity, the shaking and both models, with receiver noise at the most favourable specified level (18 dB per cell), cannot reach 95% at 5% below 1.5 × 10⁻⁸ m⁴, whatever the pattern and whatever motion both worlds share; under quiet ground the speckle certificate, with Giza’s background in the reference, gives 1.4 × 10⁻⁹ m⁴. Under a lorry the certificate has no proved reference, since the ground without a room already moves with it. A change of the ambient motion’s phase alone moves the ground by at most twice that motion; to escape this bound, under its stated amplitude and noise, such a mechanism must change the phase over more than 858,457 m² under the regional microseisms (necessary to escape the bound, not sufficient to be detected). One with gain would have to be specified before it could be computed. Outside: changes of the surface’s reflectivity during the pass, the echo from beneath, scatterers that are not speckle, more than one image.
Told everything but the answer, an oracle still gains at most 4.7 × 10⁻⁷ under Giza’s regional trembling (3.4 × 10⁻⁵ at the noisiest stations); at the most favourable specified noise floor strong shaking close by stays below reliable detection too (at most 0.55)
The oracle
Give a detector more than any method has: the exact reflectivity of every scatterer, the background motion, the shaking’s realisation and both physical models, with the room and without. All it lacks is which is true, and the receiver noise. Its raw echoes under the two hypotheses are then Gaussian with the same covariance and means that differ by the echo of the room-specific motion alone, so its best test is known exactly, with no Pinsker step: detection − false alarm = 2Φ(Δ/2) − 1, Δ² = 2‖μ₁ − μ₀‖²/σ². A method told less does no better, whatever the ground’s texture: only independent, uniform phases are needed, and the background motion, however large, cancels exactly: E Δ² = 8 Σj SNRj ⟨sin²(k₀δj/2)⟩, δ the motion the room adds. Pulse by pulse on the real dwell (802 scatterers, 9,794 pulses) the formula holds to 0.993 ± 0.025, and to 1.011 ± 0.030 with the background ten times larger. Each pixel is taken 18.4 dB over the receiver noise: the site’s median ground measured in the image over the best noise floor ICEYE specifies for the mode (−23.7 dB, documentation 6.0.8; a scenario, not a measurement).
Depth is carried by the mark’s shape
Could shallower voids mimic a deeper one? Small rooms 15 m down, spread over the ground in any non-negative mix, leave 71% of the bench room 30 m down’s mark unmatched (the lab’s solver; two solved together agree with their sum to 3.7%), and the bench room 15 m down alone 78%. In uniform rock the mark changes shape with depth, so telling those depths apart takes only 1.4 times the signal that detection takes: where the data hold a room, they would hold some of its depth too. Richer classes of ground are not tested. The published method does not use this: its depth axis is a frequency axis (P2-06, P2-28).
| the oracle, the bench room | Δ | detection − false alarm | motion must grow, for 95% at 5% | after allowances (×95) |
|---|---|---|---|---|
| Giza microseisms, measured (static imprint) | 1.2 × 10⁻⁶ | 4.7 × 10⁻⁷ | 2.8 × 10⁶× | 2.9 × 10⁴× |
| The world's noisiest stations (static imprint) | 8.5 × 10⁻⁵ | 3.4 × 10⁻⁵ | 3.9 × 10⁴× | 410× |
| Giza 1-3 Hz, measured (static imprint) | 1.2 × 10⁻⁶ | 5.0 × 10⁻⁷ | 2.6 × 10⁶× | 2.8 × 10⁴× |
| Giza 3-8 Hz, measured (static imprint) | 1.1 × 10⁻⁶ | 4.3 × 10⁻⁷ | 3.1 × 10⁶× | 3.2 × 10⁴× |
| urban background, all pass (surface) | 0.021 | 8.3 × 10⁻³ | 160× | 1.7× |
| urban background, all pass, within 32 m (surface) | 1.8 × 10⁻³ | 7.1 × 10⁻⁴ | 1.8 × 10³× | 19.5× |
| truck over a bump 15 m away, all pass, at 52 Hz (surface) | 0.3 | 0.12 | 10.9× | not excluded after allowances |
| truck over a bump 15 m away, all pass, within 32 m, at 36 Hz (surface) | 0.029 | 0.012 | 110× | 1.2× |
| urban background, all pass (surface_favourable) | 0.11 | 0.043 | 30.4× | not excluded after allowances |
| urban background, all pass, within 32 m (surface_favourable) | 0.011 | 4.5 × 10⁻³ | 290× | 3.1× |
| truck over a bump 15 m away, all pass, at 72 Hz (surface_favourable) | 1.5 | 0.55 | 2.2× | not excluded after allowances |
| truck over a bump 15 m away, all pass, within 32 m, at 59 Hz (surface_favourable) | 0.17 | 0.069 | 19.0× | not excluded after allowances |
| urban background, all pass (p_below) | 0.025 | 0.01 | 130× | 1.4× |
| urban background, all pass, within 32 m (p_below) | 2.2 × 10⁻³ | 8.9 × 10⁻⁴ | 1.5 × 10³× | 15.6× |
| truck over a bump 15 m away, all pass, at 88 Hz (p_below) | 0.42 | 0.17 | 7.8× | not excluded after allowances |
| truck over a bump 15 m away, all pass, within 32 m, at 80 Hz (p_below) | 0.032 | 0.013 | 100× | 1.1× |
| urban background, all pass (s_below) | 0.026 | 0.01 | 130× | 1.3× |
| urban background, all pass, within 32 m (s_below) | 2.0 × 10⁻³ | 8.1 × 10⁻⁴ | 1.6 × 10³× | 17.2× |
| truck over a bump 15 m away, all pass, at 88 Hz (s_below) | 0.49 | 0.19 | 6.7× | not excluded after allowances |
| truck over a bump 15 m away, all pass, within 32 m, at 93 Hz (s_below) | 0.033 | 0.013 | 98.2× | 1.0× |
| corner reflector on the peak, microseisms | 4.3 × 10⁻⁶ | 1.7 × 10⁻⁶ | 7.7 × 10⁵× | 8.1 × 10³× |
| corner reflector on the peak, truck over a bump, 15 m | 0.067 | 0.027 | 49.4× | not excluded after allowances |
The allowances are assumptions, stated so the margin can be judged: the local ambient level ten times the regional, site amplification three times, and 10 dB more signal-to-noise. Where the margin does not survive them the case is marked open: not excluded by this argument, which is not the same as detectable. The values are upper bounds (bounds on the displacement integral, averaged over phases, the scattered wave carried unattenuated across the whole scene, each wave direction with its own); a large one says only that this argument does not exclude detection, and only an implemented detector succeeding on independent tests would show a regime works. That regime needs a physical limit on how much motion a room can add, which the statistics cannot supply.
In the rooms modelled the responses are broad: rung on its ceiling, the longest-lived mode resolved has Q 2; a room under a 5 m roof moves the ground over it up to 2.0 times the passing motion
The lab’s elastic solver, with and without the chamber, waves from the side and from below, in rock with no attenuation, records of 0.3–0.5 s (P2-26). The largest imprint under a surface wave is 0.16 of the motion at 79 Hz (its band cut by the model’s upper limit: the width of the largest response’s envelope, not a modal Q); no curve has a peak standing 20% above its surroundings at these records’ resolution. Halving the grid changes the imprint by at most 6% below 120 Hz (11% for the room under a 5 m roof).
These rooms, excitations and windows gave broad responses
A resonance is the one way physics could make the imprint far larger than the static answer, and a short record cannot exclude a long-lived narrow one (a 60 Hz mode with Q 600 takes 3 s to fall by 1/e). So each room was also struck on its ceiling and recorded for 4 s beside intact rock: the largest modal Q resolved from the spectrum’s peaks at 0.50 Hz is 2.2, with no peak within 30 dB of the largest narrower than that. How long the energy lingers is set by the model’s own residual floor, not by the rooms: the same pulse in intact rock with no room lingers 6–16 s, and a room at most 1.07 times as long, so a long-lived mode weaker than that floor is not excluded. Over 4 s of a passing surface wave, 0.01% of the imprint’s energy at the ground comes after the wave has passed. Under the surface wave the bench room’s imprint grows with frequency until the wave is short enough to pass over the room; the room under a 5 m roof flexes with it, up to 2.0 times the passing motion near 65 Hz (2.1 near 59 Hz on the finer grid). At the low end the imprint meets P2-04’s static answer (0.96 of it at 7 Hz). Only these rooms, excitations and windows are covered: fractured, layered or coupled structures, and the air inside a room, are not modelled.
What decides the faster shaking is how far the wave the room scatters carries. The oracle counts the imprint within 32 m exactly and the scattered wave out across the whole 7 km scene, unattenuated, and gives the truck 0.12; within 32 m alone, far less. The speckle bound’s values here (1.6 × 10⁻³ for the hum, 0.023 for the truck) are surrogates: its reference leaves out the source’s own motion, which the ground without a room also has.
What the bound assumes: ordinary ground is fully developed speckle (bright points are bounded separately, above, and the genie row holds for any scene); the image forms by the Doppler-to-time relation; the rock is modelled as linearly elastic and unattenuated (its nonlinear response is not modelled); the chamber is the bench’s, a 6 m room 15 m down, shallower and more favourable than anything claimed; the ambient levels are the regional and published ones cited. What it does not cover: penetration at longer wavelengths (P band could reach a shallow room, blurred into a 25 m cell), changes of the surface’s reflectivity during the pass, texture between speckle and bright points, and many images, which can measure slow deformation (P2-11). No part of it has yet been checked against measured ground motion and radar data taken together: the geophone-and-satellite comparison (P2-22, P2-23) is simulated.
How sure: established, measured with limits, modelled, or open
| claim | status | rests on | what would change it |
|---|---|---|---|
| The published and reconstructed depth axes are frequency axes of the registration, with a repeat and a mirror: absolute depth is uncalibrated and not unique | established | the processing’s algebra (P2-06), its code (P2-13, P2-14), an independent check | a physical model deriving depth from the registration, validated on known voids; it does not decide horizontal location or shape |
| The published method was not shown to recover horizontal location or outline where the data hold them, at any depth | measured in simulation: not shown better than chance, where a reference detector succeeds | a room, an L-shaped and a branching tunnel generated through the forward model and amplified to 20 rad: a reference detector told the shaking names 100% and places them 0.6 m from their centres; the published map read blind names 44% (p 0.37 with labels permuted within the three scenes, a null test) and centres 7.1 m off, the controls 6.2 m (P2-31) | a frozen method recovering withheld layouts, with the same depth freedom given to nulls; a physically strong positive control (a lorry or vibrator beside the layouts) |
| Correlating one image’s looks registers little of ordinary ground’s motion | measured, for that estimator | P2-03 on real texture; an exact identity for whole images, an approximation for patches | an estimator shown to recover planted ground motion on real texture |
| The six-second pairs register little of a vibration | measured in simulation | P2-15, confirmed pulse by pulse (P2-18) | shaker and reflector data showing more |
| The gated reconstruction does not respond to a known vibration a standard tracker measures | measured in simulation | synthetic products through its own loader (P2-19) | a frozen setting at which it recovers a planted vibration’s frequency, place and amplitude |
| Over a known chamber, the gated reconstruction’s picture does not depend on the chamber | measured in simulation | the one-chamber bench as synthetic products, shaken inside the band it reads, the chamber boosted up to ×10⁸, beside a null (P2-20) | real ground over a known void, or a forward model with more physics, that behaves otherwise |
| Shaken by one vibrator, geophones find a chamber the satellite could find only with 2 million times the force, reflectors laid over it | measured in simulation | the elastic solver (P1-01), the pulse-checked radar simulator (P2-18), a tracker calibrated on known reflectors (P2-22, P2-23) | a single-image reading far more precise than tracking bright points, or ground carrying far brighter points than open plateau |
| What the gated reconstruction draws across Khafre and Khufu does not survive a change of pass | measured on real images | runs of one square, each beside a motionless copy (P2-21; Khufu, P2-41) | agreement beyond chance and beyond an image’s own copy, over surveyed voids and matched controls |
| The gated reconstruction’s patterns also appear with nothing moving and nothing inside | measured, not a calibrated rate | two synthetic twins and open desert (P2-13, P2-14) | a frozen recipe that beats nulls with the same correlations on withheld truth |
| A small chamber changes ambient motion by under a ten-thousandth; one dwell falls far short | modelled | uniform rock, quasi-static strain, regional ambient level (P2-04, P2-05) | motion measured on the plateau during a pass; resonant or larger structures |
| Other routes carry far too little at X band | modelled estimates | penetration, loads, heat, surface (P2-11) | measured penetration in Mokattam limestone; deformation over known voids |
| Single images measure vibration of bright targets | established | 2026 papers with ground truth; P2-03 | none |
| However one image of ordinary ground is read, the bench chamber’s imprint on the ground’s motion lets no test’s detection rate exceed its false-alarm rate by more than 1.3 × 10⁻⁹ under Giza’s regional microseism level; under an urban hum or a truck bouncing 15 m away all pass the oracle’s bound, told the texture, is 8.3 × 10⁻³ and 0.12; one image without the texture, bounded line by line with the lorry’s wave in each line’s reference, allows at most 0.12 for a room under a 5 m roof, its location to 6 m or its shape (the benchmark, P2-36, at the worst sampled frequency; the oracle’s bound stops excluding 95% at 5% only at 28 dB) | bounded: a theorem within a model | fully developed speckle, the Doppler-to-time relation, linear elasticity, the chamber’s imprint by the elastic solver at every frequency, the regional ambient levels; a bound, within 1.4 times of the best test on small test images (P2-25, P2-26) | ground whose texture departs from speckle beyond bright points; shaking far above these levels for a whole pass; an imprint beyond linear elasticity; measured ground motion and radar data that disagree |
| Under stated conditions a detection needs the room-specific motion to reach a displacement integral (∫ maxt|Δu|² dA) of 1.5 × 10⁻⁸ m⁴, whatever its pattern and whatever motion both worlds share; for a smooth pattern, at least 3 mm at microseism frequencies, 47 µm at 80 Hz | a conditional requirement | the Giza dwell, the oracle told everything but the answer with receiver noise at the most favourable specified level (18 dB per cell: the site’s measured ground over ICEYE’s best specified noise floor for the mode, a scenario rather than a measurement), 95% found at 5% false alarms (P2-27, P2-29); the speckle certificate agrees under quiet ground; corrected after two reviews | a mechanism shown to put that much motion on the ground over a justified extent; a measured noise floor for the real product; routes outside the model (reflectivity changes, the echo from beneath, more than one image) |
| Whether a single image at a longer wavelength, or many images, could sense a subsurface structure | open | estimates only (P2-11) | the tests under What would settle it |
A satellite can measure a bright target shaking; in our tests ordinary ground’s trembling barely registers, and perfect measurements read the published way would not locate a chamber
Can a satellite measure vibration from one pass?
Yes, for bright, isolated targets that move a lot: in 2026, corner reflectors on shakers and a steel footbridge were measured from orbit at 0.66 mm/s and up, to about 1 mm/s. Ordinary ground is much harder. In our test on the real Giza image, correlating one image’s looks recovered 1% of a patch of ground’s planted motion, and Giza’s natural trembling is 13,000 times below the smallest motion measured from orbit so far. The 77 µm/s once quoted here was the scatter of a reading that barely responds to the ground’s motion, not a sensitivity.
If every pixel’s vibration were known perfectly, would it show a chamber?
Not at the right depth by the published method: its depth is the frequency of the motion, so given the exact motion at every pixel it puts the trembling at one depth over rock and over a chamber alike; it would still draw it brighter where the chamber changes the motion, so where the chamber is could survive with its depth wrong (P2-06). Nor, in our simulations, by passive seismic imaging within one pass: the ground’s trembling comes in waves kilometres long, too coarse to outline a room, and a pass lasts 24.5 s. Even with short waves, perfect instruments on the ground and the rock known exactly, passive imaging shows the chamber no brighter than its surroundings after a minute of recording (1.0×), 1.9× after an hour, and never 3×.
Isn’t a million virtual seismometers better than a few real ones?
Only if they hear. In our test, made into 3,264 virtual sensors and shaken by a wave put into the image, they recovered 0% of it read the published way. Averaging deaf sensors gives a precise zero. Where magnitudes hear a fifth, the chamber would need 2 × 10¹⁹ sensors over it; the whole image holds 7 × 10⁷. Over the chamber, one pass’s reading wanders 10,000 times more than a real seismometer records there.
Seismic instruments find the chamber; why doesn’t the satellite, here?
The ones that find it make their own waves. A hammer blow sends a sharp wave about 15 m long, timed exactly, and instruments pressed against the ground record its echo within 34 ms: the chamber comes back 6× brighter than its surroundings. Listening to the ground’s own trembling instead works only weakly, even with perfect instruments (2.2× with unlimited listening). A satellite has no hammer, listens for 24.5 s, registers little of ordinary ground’s trembling in our tests, and its looks follow slow motion best, a few tenths of a hertz, whose waves are kilometres long.
The benchmark has begun: the simulator holds up against pulses, a vibration a tracker measures leaves the gated pipeline silent, and over a known chamber its picture does not depend on the chamber
The radar simulator, checked against pulses
A second simulator computes what the radar records pulse by pulse, from every scatterer’s exact distance at each moment, displaced by its own motion, and forms the image by back-projection on the product’s grid. It focuses a point to 4.73 cm in azimuth against 4.71 cm in theory. Its frequency slices match the images formed from only the matching stretches of pulses, 0.981 to 0.997 in complex correlation, with the mirrored slices at 0.000: a Doppler slice is a stretch of the pass, shown by a calculation that never assumes it. The fast synthesizer’s image of the same scatterers matches it to 0.91, and a steady 5 mm/s recession shifts the image 41.8 cm against 42.0 cm from theory. Through the six-second pairs, pulses and the fast injection agree where the shifts are resolvable (0.094 and 0.094 px at 20 mm/s, 0.26 Hz), and the rest sit at or below one rounding step in both.
A known vibration: a tracker measures it, the gated pipeline does not register it
| the reflector vibrates | tracker reads | pipeline’s shift | passes there |
|---|---|---|---|
| 5 mm/s at 1.07 Hz | 5.1 ± 1.1 of 5.0 mm/s | 0.0003 px | 0 |
| 5 mm/s at 3.21 Hz | 2.4 ± 1.1 of 4.8 mm/s | 0.0013 px | 0 |
| 20 mm/s at 0.26 Hz | 19.2 ± 1.0 of 20.0 mm/s | 0.0921 px | 0 |
Synthetic products in the ICEYE layout, read by the reconstruction’s own loader unchanged, hold static speckle and a corner reflector 50 dB above it, simulated pulse by pulse. The same files carry a vibration a standard tracker reads through 50 ms looks. The gated pipeline’s shifts at the reflector move by about a thousandth of a pixel at its own modes’ frequencies, it passes nothing at the reflector at any support, and it passes 5 to 30 positions per line in the static speckle around it. As a measurement control it fails at these settings: it does not respond to a vibration that is there and measurable.
Over the known chamber, the gated pipeline’s picture changes no more with the chamber than with random noise of its size, even boosted a hundred million times
| the bench’s product | values changed | positions passing | scores changed | of them within 12 m |
|---|---|---|---|---|
| without the chamber | 0 | 275 | – | – |
| with it, at its real level | 4,875 | 277 | 178 | 6 |
| a random perturbation of that size | 4,796 | 276 | 182 | 4 |
| its imprint ×10⁴ | 316,018 | 277 | 242 | 6 |
| its imprint ×10⁸ | 496,149 | 280 | 300 | 9 |
The one-chamber bench as a synthetic product the reconstruction reads unchanged: speckle shaken as Giza shakes, at 0.2 Hz and with the measured 1–3 Hz level placed on the method’s own second mode, 2.14 Hz, where it looks. The chamber’s imprint (P2-04) rides on that shaking at its real level, then boosted until it moves the ground over the chamber by 3.6 mm/s. Each product is compared with the one without the chamber, beside a random perturbation the size of the real-level imprint; 3% of the 2,601 positions lie within 12 m of the chamber’s axis, so changes that gather over it would show there first. Changes in the last digits of the numbers the pipeline reads move its fit scores at a position by up to 0.50 on its scale of 0 to 1, the chamber’s and the random perturbation’s alike. The positions that pass at all are set by the speckle, and at the method’s own support of four none pass. Open the volumes in the lab, under the satellite’s gated reconstruction.
p2_18_echo_validationdatacode
| acquisition | giza-20220715 |
| prf simulated | 1,000 |
| V eff m s | 7354 |
| bandwidth hz | 300,000,000 |
| dwell s | 24.56 |
| gated module sha256 | 3e1154c11274b896b91e262198576ffd750732709ad08ac00c6892c4ea5e1b1d |
| environment | python 3.11.3 · numpy 2.4.6 · numba 0.67.0 · threads 16 · cpus 16 |
| source at | 994469d |
p2_19_known_vibrationdatacode
| acquisition | giza-20220715 |
| shape | 8,192, 384 |
| scr db | 50 |
| cases | still, 0, 0, mode1_5mm, 0.005, 1.069, mode3_5mm, 0.005, 3.207, slow_20mm, 0.02, 0.26 |
| track rows | -8, -4, 0, 4, 8 |
| supports | 1, 2, 4, 5 |
| gated module sha256 | 3e1154c11274b896b91e262198576ffd750732709ad08ac00c6892c4ea5e1b1d |
| gated profile sha256 | ae84cade31f7e5ffa9b4daa0eba152649d2afc7f1655415bad38553f4f4d69aa |
| environment | python 3.11.3 · numpy 2.4.6 · numba 0.67.0 · threads 16 · cpus 16 |
| source at | a46ecd7 |
p2_20_bench_gateddatacode
| acquisition | giza-20220715 |
| shape | 8,192, 640 |
| step m | 2.4 |
| half m | 60 |
| cases | without, 0, with, 1, null, —, boost_1e4, 10,000, boost_1e8, 100,000,000 |
| bands | frequency_hz 0.2 · strain 1.09e-11 · vertical_velocity_m_s 4.9e-8, frequency_hz 2.138 · strain 1.145e-11 · vertical_velocity_m_s 2.9e-8 |
| band sources | M1-01 median, 0.1-0.3 Hz; phase speed sites/ambient.json, M1-01 median; the rock's own Rayleigh speed, slower than the real waves, so the strain is generous; placed on the gates' mode 2 |
| taper m | 10 |
| near m | 12 |
| supports | 1, 4 |
| gated module sha256 | 3e1154c11274b896b91e262198576ffd750732709ad08ac00c6892c4ea5e1b1d |
| gated profile sha256 | ae84cade31f7e5ffa9b4daa0eba152649d2afc7f1655415bad38553f4f4d69aa |
| environment | python 3.11.3 · numpy 2.4.6 · numba 0.67.0 · threads 16 · cpus 16 |
| source at | 3c68cdf |
Where the data hold the chamber, the gated reconstruction’s picture does not change over it
| the bench shaken by the vibrator | passing, support 1 | support 4 | scores changed | of them within 12 m |
|---|---|---|---|---|
| at the reflectors’ boundary, no chamber | 633 | 67 | – | – |
| the chamber in it | 635 | 71 | 646 | 32 |
| random noise of the chamber’s size | 639 | 67 | 648 | 32 |
| a thousandth of that force, no chamber | 465 | 54 | – | – |
| the chamber in it | 465 | 54 | 454 | 54 |
| random noise of the chamber’s size | 464 | 54 | 456 | 54 |
The same shaking P2-23 reads, at the force where the corner reflectors let the favourable detector find the chamber: speckle, the real image’s bright points and the row of reflectors, all moving with the vibrator at the method’s own tenth mode, run through the public Replication and Verification of the Biondi Protocol unchanged. Strong shaking makes it pass more positions, some of them at its own support of four; the question is whether the chamber changes its picture over the chamber more than random noise of the chamber’s size does. 3% of the positions lie within 12 m of the chamber’s axis.
p2_22_one_shakingdatacode
| site | bench-void |
| frequency hz | 10.69 |
| mode | 10 |
| source m | -30, 0, 0 |
| extent m | -150, 150, -150, 150, -100, 3 |
| spacing m | 1 |
| pml cells | 20 |
| cycles | 3, 12 |
| cases | none — · bench centre 0, 0, -15 · size 6, 6, 6 · favourable centre 0, 0, -10 · size 10, 10, 10 |
| recorded half m | 60 |
| environment | python 3.11.3 · numpy 2.4.6 · numba 0.67.0 · threads 16 · cpus 16 |
| source at | aeffc33 |
p2_24_gated_on_the_shakingdatacode
| acquisition | giza-20220715 |
| shape | 8,192, 640 |
| frequency hz | 10.69 |
| forces n | 25170000000, 25170000 |
| supports | 1, 4 |
| source clear m | 10 |
| p2 23 commit | 7e1138f |
| step m | 2.4 |
| half m | 60 |
| gated module sha256 | 3e1154c11274b896b91e262198576ffd750732709ad08ac00c6892c4ea5e1b1d |
| gated profile sha256 | ae84cade31f7e5ffa9b4daa0eba152649d2afc7f1655415bad38553f4f4d69aa |
| environment | python 3.11.3 · numpy 2.4.6 · numba 0.67.0 · threads 16 · cpus 16 |
| source at | 6e4e32e |
p2_23_every_readerdatacode
| acquisition | giza-20220715 |
| frequency hz | 10.69 |
| record s | 24.56 |
| alpha | 0.01 |
| power | 0.9 |
| geophones | -24, -24, -24, -16, -24, -8, -24, 0, -24, 8, -24, 16, -24, 24, -16, -24, -16, -16, -16, -8, -16, 0, -16, 8, -16, 16, -16, 24, -8, -24, -8, -16, -8, -8, -8, 0, -8, 8, -8, 16, -8, 24, 0, -24, 0, -16, 0, -8, 0, 0, 0, 8, 0, 16, 0, 24, 8, -24, 8, -16, 8, -8, 8, 0, 8, 8, 8, 16, 8, 24, 16, -24, 16, -16, 16, -8, 16, 0, 16, 8, 16, 16, 16, 24, 24, -24, 24, -16, 24, -8, 24, 0, 24, 8, 24, 16, 24, 24 |
| noise asd m s rthz | kottamya_median 4.195e-9 · kottamya_period_s 0.1297 · peterson_high 3.961e-7 · peterson_period_s 0.1 |
| look s | 0.02 |
| cal scr db | 30, 40, 50 |
| cal v m s | 0.05 |
| cal seeds | 230, 231, 232 |
| reflector scr db | 50 |
| reflector step m | 3 |
| reflector half m | 30 |
| plateau m | -470, -600 |
| p2 22 commit | 110d416+ |
| environment | python 3.11.3 · numpy 2.4.6 · numba 0.67.0 · threads 16 · cpus 16 |
| source at | 7e1138f |
What would settle it: one frozen recipe reproduced, a motion test with ground truth, and a blind test on known voids
Reproduce one nominated result
Take one figure the method’s proponents consider successful, with its image, exact geometry, code version, settings and plotting frozen and hashed, and have an independent reviewer regenerate it. Then run that frozen recipe on motionless copies, open ground and a planted motion. So far, attractive figures and negative tests have concerned different recipes.
Show that the estimator measures motion
Run the frozen pipeline on stationary scenes, on moving targets simulated from independent physics, and preferably on shaker or corner-reflector data with instruments on them at the same time. Sweep frequency and amplitude, 0.26 and 3.66 Hz included, and score recovery before the gates as well as after, beside an estimator already validated for vibrometry, so that a faulty injection is not mistaken for a failed method. Begun below with synthetic products (P2-19).
Predict known voids blind
Choose known voids and matched surveyed controls and withhold their labels. Fix the wavelength, line placement, gates and scoring in advance; predict places, depths and sizes with tolerances; count false positives as well as hits; use a site or pass not used for calibration. Before reading stairs or spirals, a forward model built on independent wave and radar physics should tell a plain column, a spiral and nothing apart.
What would change this page: a frozen recipe that passes these tests, or measurements that contradict our models, such as motion measured on the plateau during a pass, penetration measured in Mokattam limestone, or a pulse-level simulation of the pairs that registers more than ours. A bounded validation of this kind is worth more than further compelling pictures, whichever way it comes out.
The evidence in detail · each section opens on its heading
The real dwell has three speeds, and the simulator now has all three
A Spotlight DwellSpotlight Dwell radarAn ICEYE mode that keeps the beam on one scene for tens of seconds, here 24.5 s, far longer than a normal image needs. holds the beam on Giza for 24.5 s. The platform moves at 7,662 m/s, the image’s rows sweep the ground at 7,014 m/s, and the Doppler history runs at 7,330 m/s, their geometric mean to 9 parts per million. The first simulator used one speed and put the Doppler rate 8% off. Every second of aperture is also a change of viewing direction, and a look’s resolution times its duration is fixed by the orbit: a 1.96 s look resolves 0.56 m, a 0.25 s look 4.4 m. Looks are cut from the image’s Doppler band, and for each pixel every Doppler frequency is a moment of the pass, counted from that pixel’s own zero-Doppler moment: its Doppler falls by 5,662 Hz every second, so slicing the band in frequency is slicing each pixel’s 24.5 s in time, and a slice half the band wide averages 12.2 s of whatever the ground did. Across a patch the size of a pyramid those zero-Doppler moments differ by hundredths of a second.
| Giza | Sacsayhuamán | |
|---|---|---|
| Satellite | ICEYE-X33 | ICEYE-X35 |
| Date | 2025-08-27 | 2025-08-22 |
| Processed aperture | 24.49 s | 19.94 s |
| Incidence | 20.8° | 20.5° |
| Wavelength | 3.12 cm | 3.12 cm |
| Resolution, azimuth × slant | 4.5 × 22 cm | 4.4 × 22 cm |
| Platform, ground sweep, effective speed | 7,662 · 7,014 · 7,330 m/s | 7,717 · 7,186 · 7,447 m/s |
| Platform travel over the aperture | 187.6 km | 153.9 km |
| A look’s resolution × duration | 1.10 m s | 0.89 m s |
Read from each product’s metadata into sites/acquisitions/. On this geometry the synthesizer’s point response is 4.48 × 22.1 cm as predicted, and a target receding at 2 mm/s moves -0.159 m in azimuth, read back as 2.001 mm/s. The earlier “168 km” was the span of one bank’s sub-aperture centres (168.8 km), not the platform’s travel.
p2_01_geometrydatacode
| products | giza-20250827 ICEYE_X33_SLC_SLEDF_951562307_20250827T202654.h5 · sacsayhuaman-20250822 ICEYE_X35_SLC_SLEDF_5907293_20250822T152433.h5 · giza-20220715 ICEYE_X13_SLC_SLED_868226_20220715T235744.h5 |
| reference bank | K 50 · width_frac 0.1 |
| look durations s | 0.25, 0.5, 1, 1.96, 4 |
| environment | python 3.11.3 · numpy 2.4.6 · numba 0.67.0 · threads 16 · cpus 16 |
| source at | 7583420 |
Correlating one image’s looks registers little of ordinary ground’s motion
Every single-image method, published or ours, reads motion by registering one image’s looks against each other. Two such looks share the spectrum they overlap. For whole images and real, non-negative masks their cross-spectrum is then real and non-negative, so their correlation peaks at zero lag whatever the ground does: an identity. Registration works on small patches, which mix frequencies, so there the identity is a strong pull toward zero rather than a proof, and it has to be measured. For ground whose specklespeckle radarThe grainy texture of radar images of natural ground: many small scatterers in each cell interfering. Each Doppler bin holds an independent speckle pattern. is independent in every Doppler bin, motion shared by a patch also leaves the image’s statistics unchanged. Here a 20 m stretch of the real Giza image is made to sway at 2 mm/s, and read three ways.
Relative to the reference look. Complex registration recovers 1% ± 1%, magnitudes 21% ± 7%; the motion is in the data (101% against the twin).
Looks 1.96 s wide. The real crop’s own power spectrum reproduces its measured coherence to within a billionth: R9 measured the looks, not the ground.
1.96 s looks pass little above 0.3 Hz, but a tracked point does not follow the boxcar exactly: at 0.5 Hz it keeps 21% where the boxcar keeps 2%. The first investigation’s R7 injected at 1, 2 and 3 Hz, where a bright point comes back at 10%, 4%, 1%.
What each way of reading recovers
| complex | magnitudes | twin | |
|---|---|---|---|
| ordinary ground, simulated on the real geometry | 3% ± 1% | 10% ± 2% | 102% |
| ordinary ground, the real Giza image | 1% ± 1% | 21% ± 7% | 101% |
| a lone bright scatterer, simulated | -6% ± 3% | 100% ± 2% | 103% |
Magnitudes catch what is point-like in the ground, more on the real plateau than in simulated speckle; a lone bright scatterer’s envelope follows its motion in full. “Twin” reads each look against the same look of the motionless scene, which only a simulation has: it shows the motion was there to be seen.
p2_03_what_a_dwell_seesdatacode
| geometry | giza-20250827 |
| look s | 1.96 |
| looks | 16 |
| image px | 2,048, 128 |
| motion | f_hz 0.1 · v_m_s 0.002 · block_half_m 10 |
| bright amplitude | 300 |
| lowpass hz | 0.05, 0.1, 0.25, 0.5, 0.75, 1, 2, 3 |
| real crop | desert_west (legacy R1/R9 patch) |
| environment | python 3.11.3 · numpy 2.4.6 · numba 0.67.0 · threads 16 · cpus 16 |
| source at | d9e33c2 |
In our model, a chamber changes the ground’s own motion by less than a ten-thousandth of it
Whatever a satellite could use to find a chamber passively would have to be its imprintimprint seismic · radarThe difference a buried chamber makes to how the surface moves as a wave passes: what any passive method would have to detect.: the difference it makes to how the surface moves. Ambient waves are far longer than the chamber and its depth, so the rock around it is strained almost uniformly and almost statically. The lab’s solver answers the static question directly: load the rock with a uniform horizontal stress, open the chamber, and let the ground settle. It is a model: one small chamber in uniform rock, strained quasi-statically; layering, the sand cover, resonance and other forcing are not in it.
Without the chamber nothing moves. On a 0.5 m grid the epicentre sinks 18.7 µm against 18.0 µm on 1 m; domains from 100 to 180 m wide agree to four digits. The analytic curve is a point sphere of equal volume.
The imprint on the line-of-sight velocity
| the ground’s motion | moves at | imprint |
|---|---|---|
| Giza microseisms, measured | 0.049 µm/s | 3.2 × 10⁻⁶ µm/s |
| The world's noisiest stations | 3.5 µm/s | 2.3 × 10⁻⁴ µm/s |
| Giza 1-3 Hz, measured | 0.029 µm/s | 3.4 × 10⁻⁵ µm/s |
| A truck over a bump 15 m away | 100 µm/s | 0.88 µm/s |
A passing Rayleigh waveRayleigh wave seismicA wave that rolls along the ground surface, slightly slower than S, carrying most of a hammer blow’s energy. It samples to about a third of its wavelength in depth. strains the ground by its horizontal-to-vertical ratio times its speed of motion over its phase speed, whatever its frequency, so the imprint is a fixed fraction of the motion for a given wave speed: 6.6 × 10⁻⁵ for microseisms. The truck is only a guide: at 15 Hz the waves are 110 m long, not long compared with the depth.
p2_04_chamber_imprintdatacode
| site | bench-void |
| rock | limestone-mokattam |
| vp | 3,300 |
| vs | 1,830 |
| rho | 2,400 |
| poisson | 0.278 |
| chamber | type box · centre 0, 0, -15 · size 6, 6, 6 |
| stress pa | 1,000,000 |
| relaxation s | 0.5 |
| damping per s | 30 |
| receivers | 80 m square at 2 m |
| line of sight | -0.3485, -0.06857, 0.9348 |
| environment | python 3.11.3 · numpy 2.4.6 · numba 0.67.0 · threads 16 · cpus 16 |
| source at | d9e33c2 |
Within our model, allowing every advantage we could name, one dwell falls short by ten thousand to a hundred million
The smallest imprint a dwell could detect, from what P2-03 measured: every one of its independent looks counted as a full measurement, a 3-sigma threshold, the look’s gain at the imprint’s frequency (a boxcar value; near 0.2 Hz it is within about 15% of the tracker’s measured gain), and the best tracker for each target. Under Giza’s microseisms that is 900 µm/s on the plateau’s own texture, 62 µm/s on a bright scatterer directly above the chamber, and 6 µm/s on a corner reflector that no archive image contains, against an imprint of 3.2 × 10⁻⁶ µm/s. For the plateau the ground would have to shake at 14 m/s, beyond the strongest earthquakes recorded, for the whole dwell.
| short by | Giza microseisms, measured | The world's noisiest stations | Giza 1-3 Hz, measured | A truck over a bump 15 m away |
|---|---|---|---|---|
| ordinary ground, complex registration (published protocols, R4) | 10⁹ | 10⁷ | 10⁸ | 10⁵ |
| ordinary ground, magnitudes | 10⁸ | 10⁷ | 10⁸ | 10⁴ |
| a lone bright scatterer | 10⁷ | 10⁵ | 10⁷ | 10³ |
| a corner reflector 20 dB brighter (designed; in no archive image) | 10⁶ | 10⁴ | 10⁶ | 10² |
The threshold is checked by simulation: without motion the bright scatterer’s fitted sway scatters by 16 µm/s against the 21 µm/s the formula uses, and a sway at the threshold is found in 100% of 24 realisations at a 5% false-alarm rate. Motion at 1–3 Hz needs 250 ms looks, resolving 4 m; the truck needs 33 ms looks, resolving 33 m, during its few seconds. These are estimates, not measurements of Giza during a pass: the ambient level is the regional microseism level recorded 67 km away, and the imprint is P2-04’s model.
The published depth is the frequency of the registration series: 6.76 m per hertz, with a repeat and a mirror
The published focusing projects each patch’s trajectory on a steering wave whose wavenumber grows with the platform’s offset, and on a dwell the offset grows steadily with time. So the focusing is a Fourier transform over time, and motion at frequency f appears at a depth of f times λs R sin θ / 2Vs, whatever is under the ground; with regular sampling each depth also has a repeat and a mirror. This is a property of the processing, not of Giza. Frequency-dependent imaging is legitimate geophysics; what is missing is a physical model showing why this relation describes a buried object, and validation on known voids. The scale depends on λs, a free parameter: this page uses the paper’s 0.48 m, and an independent review notes that the paper is inconsistent on it, its text implying 0.48 m and a displayed expression 0.24 m, the value the reconstruction uses. With 0.24 m every depth halves and nothing else changes. Given the exact motion at every pair, the focusing draws the same peak over two chambers and over open ground (Fig. S6), differing only in brightness.
What this shows is that depth is not identified: it is uncalibrated, it repeats and mirrors, and changing λsrescales it without changing the fit. It does not show that a recovered horizontal position or outline is an artefact: brightness still changes where the motion changes, and a method that drew the right layout at an aliased depth would be useful. Horizontal location, shape, relative vertical geometry and absolute depth are scored as separate claims (the proof page); run whole with the chamber’s imprint boosted, the published picture changes 2.8 times more over the chamber than elsewhere (P2-07), a paired comparison the method never has.
The 2022 paper’s bank on the real geometry samples time at 4.0 Hz, so its whole axis, 0 to 13.6 m, is 0 to 2.0 Hz, and faster motion folds back: Giza’s 0.6 Hz ground resonance would be drawn at 4.1 m, Khufu’s 2.3 Hz at 11.6 m.
All three peak at 1.32 m, the depth of 0.2 Hz, and agree to rounding error; only their brightness differs.
Run whole on our simulated ground, the chain does not tell the chamber is there
P2-07 runs the claim as it would have it: simulated desert over the one-chamber bench, shaking at Giza’s measured microseism level with the chamber’s imprint from P2-04, imaged on the real dwell in double precision, and put through the published pipeline unchanged (50 half-band pairs 88 Hz apart, 32-pixel patches, λs = 0.48 m). The chamber changes the image by 1 × 10⁻¹⁰ of itself (its imprint is 2 × 10⁻⁹ rad of phase) and the depth section by 1 × 10⁻⁸. The dashed outline is the chamber; with the published λs the axis ends at 13.4 m, and any other λs rescales depth without changing the fit (P2-06): a calibration ambiguity.
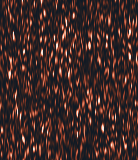 0 m13.4 m
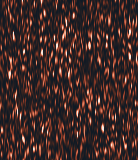 0 m13.4 m
 0 m13.4 m
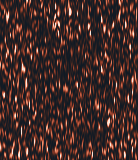 0 m13.4 m
Boosting the imprint until the method responds
| imprint × | phase, rad | section change | over the chamber | elsewhere |
|---|---|---|---|---|
| 1 × 10⁶ | 2.2 × 10⁻³ | 0% | 0% | 0% |
| 1 × 10⁸ | 0.22 | 2% | 4% | 2% |
| 1 × 10⁹ | 2.2 | 21% | 40% | 14% |
| 1 × 10¹⁰ | 22 | 75% | 104% | 65% |
| 1 × 10¹¹ | 220 | 96% | 122% | 90% |
Visible change needs the imprint multiplied by 1 × 10¹⁰, tens of radians of phase, and even then it is spread over every depth (0.68–1.25 of its mean): the texture is reshuffled, nothing is drawn at the chamber.
The ground moves 0.040 µm/s; the series wanders 398 µm/s, 9,985 times more, and not with it.
p2_07_whole_chaindatacode
| geometry | giza-20250827 |
| image px | 2,304, 256 |
| scatterers | 401,669 |
| bright stones | 40 |
| microseisms m s | 4.9e-8 |
| band hz | 0.1, 0.3 |
| phase speed m s | 3,000 |
| lam s m | 0.48 |
| bank | K 50 · sub_frac 0.5 · delta_hz 88 |
| patch px | 32 |
| targets | 3,312 |
| gains | 1,000,000, 100,000,000, 1,000,000,000, 10,000,000,000, 100,000,000,000 |
| environment | python 3.11.3 · numpy 2.4.6 · numba 0.67.0 · threads 16 · cpus 16 |
| source at | 7583420 |
The published pictures’ pillars and boxes are the method’s own arithmetic
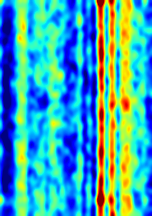
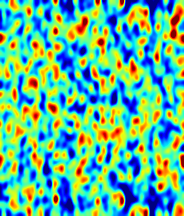
The published Khafre renderings show tall columns crossed by rungs, with blocks at their feet. P2-08 finds the same three ingredients in the real Khafre image with the published focusing, each with a plain cause, though as the paper states the method its bands stay beads and its blocks are faint; P2-35, below, finds what turns them into rungs and rooms. Pillars: averaged over a period of its depth axis, the power the method draws at a pixel is that pixel’s trajectory energy (correlation 1.000), so a pixel whose registration wanders is bright at every depth and a thick-slab rendering stands it up as a column. Such pixels lie where the surface is darker or changes brightness; open plateau with no monument draws them too, and uniform simulated ground draws none. Bands: along a column the power rises and falls every 13 m of the relabelled axis, its resolution. Blocks: at the surface and at each repeat depth, 648 m and 1,296 m relabelled, every steering phase is the same, so the power there is the pixel’s average offset (ratio 0.994); below 648 m the picture repeats.
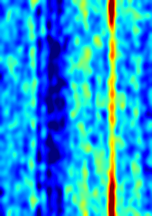 0 m700 m
 0 m700 m
 0 m
Rendered as the published pictures are: a thick slab, a log scale and a rainbow palette. The claimed chambers near 1,220 m sit close to the second repeat, 1,296 m relabelled; that is suggestive only, since the published relabelling is not known exactly. A published slice along a line is a row of pixels, each focused from its own shifts alone, so a volume is every row. The method’s “inversion” is only a Fourier transform of each pixel’s own shifts, with no waves modelled through the ground: for the Khafre patch’s47,880 pixels it takes a twentieth of a second, where a real seismic inversion of one small block takes hours (full-waveform inversion, on the seismic page). The costly step is measuring the shifts, which grows with the number of pixels; the lab refines each correlation peak locally (Guizar-Sicairos and others, 2008) instead of upsampling whole patches, so that patch took minutes, where every pixel of the whole image would take about two months.
p2_08_pillars_and_boxesdatacode
| inputs | khafre legacy cache real_giza_khafre_paper_6d230513af04.npz · plateau legacy cache real_giza_desert_west_paper_f0a750ee4bb4.npz · simulated P2-07 scene B (no chamber) |
| bank | K 50 · sub_frac 0.5 · delta_hz 88 |
| lam s m | 0.48 |
| repeat depth shown m | 648 |
| periods | 2.2 |
| environment | python 3.11.3 · numpy 2.4.6 · numba 0.67.0 · threads 16 · cpus 16 |
| source at | 51697f0 |
Rungs and rooms come from settings the paper does not state
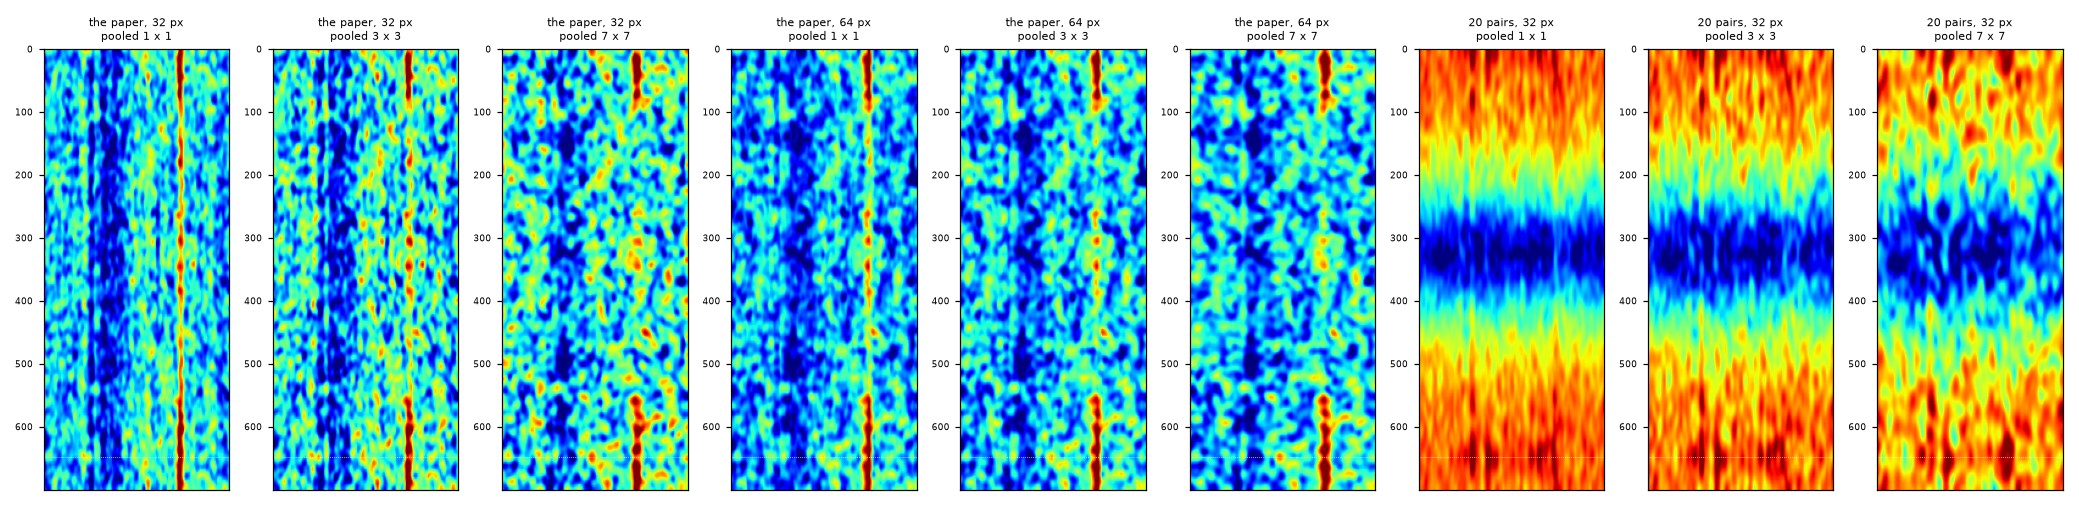
As the paper states the method (50 pairs swept across the band, 32 px patches, each pixel’s shifts its own), the strongest column’s bands correlate at 0.48 from one range position to the next, just short of lining up, and its repeat depth stands 1.2 times the column’s mean. The bands line up into rungs whenever neighbouring pixels share their shifts: averaged with their neighbours’ before focusing (0.75 over 3 × 3, 0.92 over 7 × 7), or registered on 64 px patches (0.62). A room appears only with 20 pairs taken close together, within 6% of the band (the derivative protocol v1.7’s spacing): the repeat depth stands 4.4 times the mean, where the paper’s pairs never reach 1.7. Pairs so close together hardly differ, so each pixel’s shifts change slowly from pair to pair (their average carries 7% of their energy, against 1% with the paper’s pairs), and the method draws slow change at the surface and again at every repeat. None of it depends on what lies below.
p2_35_rungs_and_roomsdatacode
| crop | the first investigation's Khafre patch (legacy real_common, giza/khafre, the 2025 pass) |
| patches px | 32, 64 |
| pools | 1, 3, 7 |
| banks | paper, v17 |
| slab lines | 31 |
| rungs threshold | 0.5 |
| room threshold | 2 |
| trend m | 60 |
| column positions | 7 |
| environment | python 3.11.3 · numpy 2.4.6 · numba 0.67.0 · threads 16 · cpus 16 |
| source at | e5d8c52 |
Stricter gates select a pattern that also appears without motion; by themselves they certify neither vibration nor depth
Later versions of the method put selection gates between the shifts and the depth focus. Pairs of images are cut from the Doppler band, each 32,330 Hz of it, which for every pixel is 6.0 s of its pass, and registered to 0.01 px. A window of 50 successive pairs is kept only if the two components of its shifts trace an ellipse at one of ten modes, fitted well, with a narrow semi-axis of at least 0.005 px and at least a tenth as wide as it is long; ten windows in a row must agree on the mode, and four or five neighbouring positions must pass together. The depth focus runs only where all of that passed. We ran such a gated pipeline, the public Replication and Verification of the Biondi Protocol (v1.8 standalone package), unchanged, twice. The first run (P2-13) used loops the lab drew up Khafre’s faces, from 20 to 95 m, because we misread the reconstruction’s “70.5 m” as a height above the base; its own lines follow the base, 70.5 m above sea level, and the second run (P2-14, below) uses them. Both run the real 2022 image beside two motionless twins of it (its brightness and spectrum, fresh speckle), the same lines over open desert in the same image, and the real image with two stretches made to vibrate at 2 mm/s along the line of sight, some 40,000 times Giza’s microseisms, at 0.26 Hz and 3.66 Hz, resonances proposed for a 648 m column of air and for the Grand Gallery.
Positions that pass every gate
| positions | features | |
|---|---|---|
| the real image | 5 | 1 |
| a motionless twin | 13 | 3 |
| a motionless twin, other speckle | 8 | 2 |
| open desert, the same image | 0 | 0 |
| the real image, vibrations planted | 9 | 2 |
With nothing moving and nothing inside, the two twins pass 13 and 8 positions (3 and 2 features); the real image passes 5 (1 feature), and open desert in the same image none. With the vibrations planted, the real image’s feature passes again, and one new feature: on the north face, where 0.26 Hz was planted, at mode 3, which stands for 3.2 Hz.
At the first gate the order is reversed: the real image passes 2.5 times as many windows as the twins, and over open desert 1.9 times; its shifts are a little less steady (36% exactly zero, against 41%). The twins and the desert are stress tests, not a calibrated false-alarm rate: they show the selected pattern can arise with nothing moving and nothing inside, under that generator, but two synthetic images cannot say how often it arises over real ground, and open desert is not surveyed ground.
What the pairs register of a vibration
The two images of a pair share 98.75% of their spectrum; in the real image 36% of the shifts are exactly zero and 75% within one 0.01 px step. We first quoted a boxcar average for how much of a motion each six-second image keeps; that is the response of a rectangular average, not of this registration. Measured through the reconstruction’s own masks and registration on simulated images, each image does carry a vibration, but at 0.06 to 45 times the boxcar value depending on frequency, and a pair registers 3–46% of the shift between its two images for a bright point and 0.6–2.8% for textured ground (Fig. S9). At 2 mm/s the pair shifts change by at most 0.011 px for a bright point, about one rounding step, and 0.0017 px for texture; in the real image the planted vibrations changed them by 0.006 and 0.002 px.
For a simple target moving along the line of sight, the azimuth shift follows its velocity, times 84 s, and the range shift only its displacement, so its trace is a thin line: the moving point passes 0 of the first gate’s windows at every frequency tested, and the measurable traces with clutter or texture are at most 0.06 as wide as they are long, under the gate’s 0.1. A scene with along-track motion, several scatterers or changing reflectivity could draw other shapes; showing that would take its own forward simulation. A 3.66 Hz tone is expected to win mode 3 (3.42 cycles a window), so a mode alone cannot tell whether a planted motion came back; frequency, place, phase and amplitude together can.
Every position that passed every gate in P2-13, in all five cases (none over open desert), set a little apart by case. 31 of 35 lie within half a cycle (3.1 m) of one of the two lines. That is what the depth fit computes, not a discovery: after the gates keep sinusoids, a window whose shifts follow m cycles is steered best by the depth whose phase turns m times across it, or by its mirror. The 35 positions form a handful of clusters, not 35 independent findings.
Simulated images on the 2022 geometry, the motion put in as a phase history through the Doppler-time mapping (an approximation shared by every motion test here). Amplitudes at the planted frequency of the pair shifts, moved minus still; points below 0.0001 px or exactly zero are not drawn. The boxcar is what a rectangular six-second average would pass; the registration departs from it both ways.
p2_13_gatesdatacode
| acquisition | giza-20220715 |
| gated module sha256 | 3e1154c11274b896b91e262198576ffd750732709ad08ac00c6892c4ea5e1b1d |
| gated profile sha256 | ae84cade31f7e5ffa9b4daa0eba152649d2afc7f1655415bad38553f4f4d69aa |
| profile | ICEYE X13 Khafre four side W50 Track10 profile |
| face height m | 70.5 |
| geoid m | 15.5 |
| fit window m | 80 |
| planted | North, 0.26, South, 3.66 |
| planted v m s | 0.002 |
| twin seeds | 101, 102 |
| heights m | 20, 35, 50, 60, 70.5, 80, 95 |
| desert centre m | -100, -640 |
| bank | support_hz 64660 · mask_width_hz 32330 · bshift_hz 404.1 · k_leap_hz 101 · pair_count 317 |
| environment | python 3.11.3 · numpy 2.4.6 · numba 0.67.0 · threads 16 · cpus 16 |
| source at | cbf806b |
p2_15_pair_responsedatacode
| acquisition | giza-20220715 |
| gated module sha256 | 3e1154c11274b896b91e262198576ffd750732709ad08ac00c6892c4ea5e1b1d |
| gated profile sha256 | ae84cade31f7e5ffa9b4daa0eba152649d2afc7f1655415bad38553f4f4d69aa |
| shape | 8,192, 144 |
| speeds m s | 0.002, 0.02 |
| frequencies hz | 0.1, 0.26, 0.5, 1.069, 2.138, 3.207, 3.66, 4.277, 5.346, 6.415, 7.484, 8.553, 9.622, 10.69 |
| scr db | 30 |
| block half m | 10 |
| environment | python 3.11.3 · numpy 2.4.6 · numba 0.67.0 · threads 16 · cpus 16 |
| source at | a94ee0f |
On its own lines round the base, nothing passes at its own settings
| positions in a row | 1 | 2 | 3 | 4 | 5 |
|---|---|---|---|---|---|
| the real image | 69 | 12 | 0 | 0 | 0 |
| a motionless twin | 28 | 4 | 0 | 0 | 0 |
| a motionless twin, other speckle | 29 | 0 | 0 | 0 | 0 |
| the real image, vibrations planted | 67 | 8 | 0 | 0 | 0 |
| open desert, the same image | 53 | 4 | 0 | 0 | 0 |
The reconstruction’s own lines follow Khafre’s base corners, 70.5 m above sea level. Given to the product’s geolocation as they were first sent, as heights on the ellipsoid, they sit about 50 px off in range; corrected for the geoid, they land on the base (the table). At its own support of four or five neighbouring positions, nothing passes on the corrected lines in any image; on the uncorrected ones, 4 pass in the real image and 0 and 0 in the twins. Loosened to a single position, the real image passes 2.4 times what the twins do, and open desert in the same image 53 against the pyramid’s 69.
Its own record: each image holds six seconds of every pixel’s pass
For any one pixel, the Doppler frequency of its echo falls steadily as the satellite passes, so each frequency in its band was recorded at one moment: the pixel’s own zero-Doppler moment plus the frequency over the Doppler rate. The pipeline’s steering makes this conversion itself, with a rate of 5,390 Hz per second at Khafre, so its 32,330 Hz images each hold 6.00 s of every pixel’s pass; it puts the four sides’ zero-Doppler moments within 0.03 s of each other. The pairs are frames of a film, each a 6-second exposure, started 19 ms apart: a shiver repeating several times a second blurs out within every frame.
Planting the vibrations adds and removes a few positions (18 start passing and 15 stop, over all five supports). In the 0.26 Hz stretch the new ones sit at modes 1, 2, 3, which no 0.26 Hz motion can make; in the 3.66 Hz stretch, one at the nearest mode. 352 of the 395 positions passing at a support of one have their best depth where their mode puts it, as a frequency fit must.
p2_14_own_linesdatacode
| acquisition | giza-20220715 |
| gated module sha256 | 3e1154c11274b896b91e262198576ffd750732709ad08ac00c6892c4ea5e1b1d |
| gated profile sha256 | ae84cade31f7e5ffa9b4daa0eba152649d2afc7f1655415bad38553f4f4d69aa |
| geometry sea level sha256 | d5c8e0c1a62135fd7a32c56fd66680bbc63bd02a4b47f20d2aaec7d80e7f791e |
| geometry wgs84 sha256 | 6c2a510cbae9ddb44530cffcc443754c057e554ff1c2743319a7610e9aecc3b0 |
| wgs84 projection height m | 85.91 |
| supports | 1, 2, 3, 4, 5 |
| planted | North, 0.26, South, 3.66 |
| planted v m s | 0.002 |
| planted positions | 30, 71 |
| twin seeds | 101, 102 |
| desert centre m | -100, -640 |
| environment | python 3.11.3 · numpy 2.4.6 · numba 0.67.0 · threads 16 · cpus 16 |
| source at | d23f20b |
The published Sphinx tomogram reproduces with its author’s code; moved one pixel, or seen from another pass, it changes
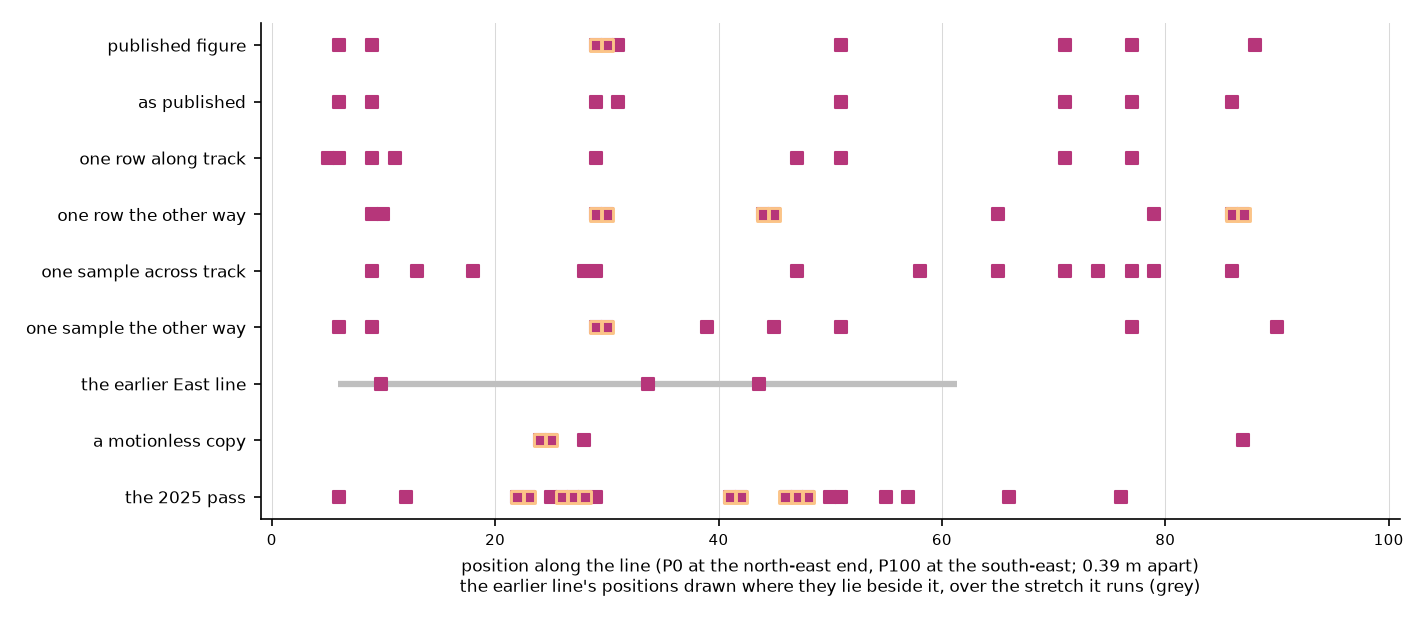
The Replication and Verification of the Biondi Protocol repository shows its gated reconstruction along a line in front of the Sphinx, the “revised East wood-avoidance line”, with the line itself and the settings in the figure’s title (persistence 7, supports 1 to 3, 0 to 50 m, the 2022 pass). Run with that code, unchanged, on that line: its ends land within half a pixel of the pixels the line file states, and 7 of our 8 columns stand where the published figure has them. Its pair at a support of two (29 and 30) appears in our runs when the line moves by one pixel. A pixel is 4.6 cm along the track and 44 cm across it on the ground; either way, moving the line by one keeps 3 to 6 of the 8 columns. The author’s earlier line runs 1.8 to 2.5 m to the west along 22 m of it: it draws 3 columns, and of the 5 we draw beside it, 1 has one of them within a position (0.39 m); a motionless copy of the image, with nothing moving, draws 4 columns of its own; the 2025 pass draws 20, 3 of them shared. One line takes about 28 s on the lab’s desktop.
p2_39_sphinx_linedatacode
| repository | https://raw.githubusercontent.com/BiondiProtocol/Replication-and-Verification-Biondi-Protocol/c0cb293 |
| figure | ICEYE_X13_Great_Sphinx_Ditch_EastWoodAvoidance_Track7_P1toP3_Tomograms_0to50m.png |
| kmz | ICEYE_X13_Great_Sphinx_Ditch_EastWoodAvoidance_GE.kmz |
| module sha256 | 3e1154c11274b896b91e262198576ffd750732709ad08ac00c6892c4ea5e1b1d |
| profile | iceye_x13_khafre_w50.json with Track 7, supports 1-3, depths 0-50 m |
| profile sha256 | ae84cade31f7e5ffa9b4daa0eba152649d2afc7f1655415bad38553f4f4d69aa |
| variants | as published, Revised East: NE, 0, 0, p22, —, one row along track, Revised East: NE, -1, 0, p22, —, one row the other way, Revised East: NE, 1, 0, p22, —, one sample across track, Revised East: NE, 0, -1, p22, —, one sample the other way, Revised East: NE, 0, 1, p22, —, the earlier East line, Previous East: NE, 0, 0, p22, —, a motionless copy, Revised East: NE, 0, 0, p22, 101, the 2025 pass, Revised East: NE, 0, 0, p25, — |
| environment | python 3.11.3 · numpy 2.4.6 · numba 0.67.0 · threads 16 · cpus 16 |
| source at | 3861feb |
Laid across the Sphinx as 151 north–south lines 0.6 m apart, with the same settings, the same code draws a volume under it, in the figure’s own colours (in the lab, its lines drawn on the ground). The real image passes 3,056 of 15,251 positions at a support of one and 444 at three; its motionless copy, with nothing moving, 1,518 and 44. Across Khafre, with the stricter frozen settings, the real image passes 1,218 positions to its copy’s 539.
Seen again from the 2025 pass, on the same lines, neither of the volume’s two blobs behaves as a void would (P2-40). The larger, at the statue’s south side, does not come back: 13% of its positions pass in 2025, where 11% pass elsewhere. The other, at its west end, stays put (40%), but the motionless copies, with nothing moving, gather there too (28% and 31%, against 9% and 8% elsewhere), and its depth does not hold: a median 6.8 m on the 2022 pass and 2.9 m on the 2025 pass, where a void would stand at one depth.
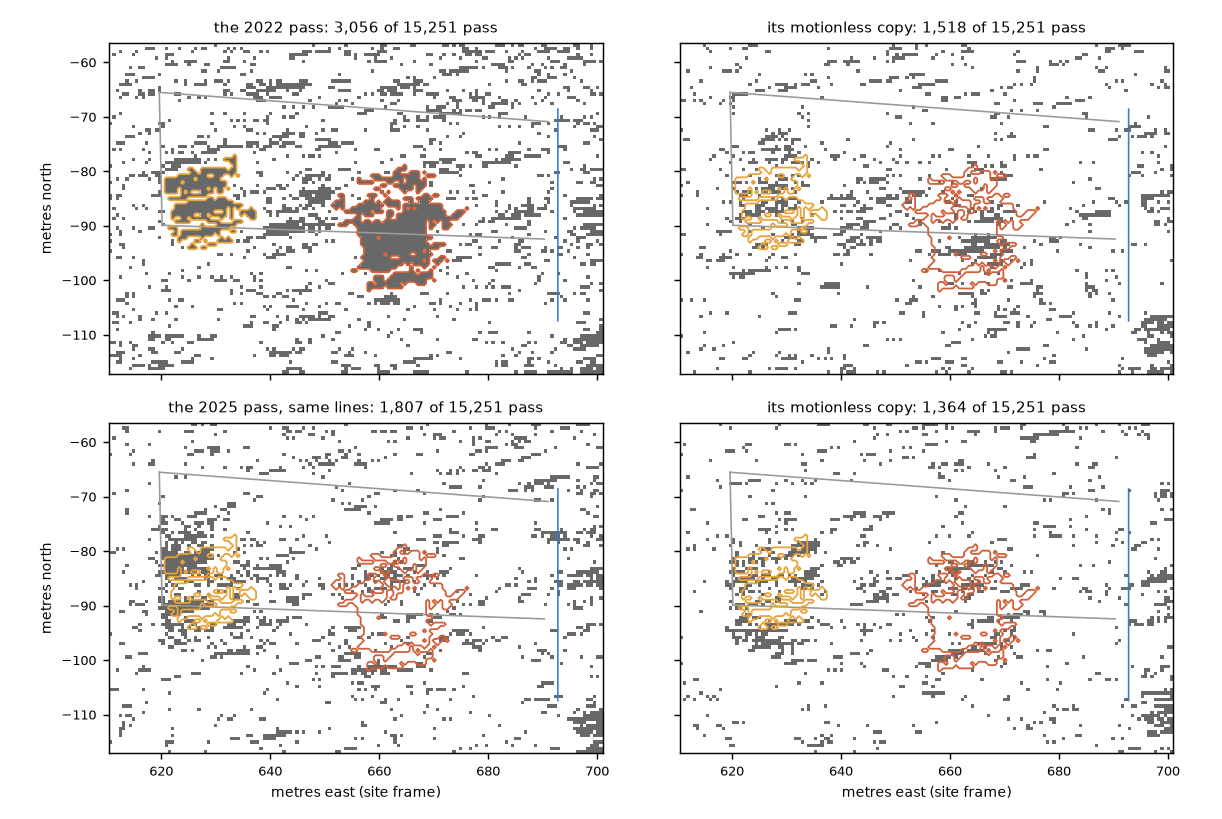
p2_40_sphinx_passesdatacode
| runs | 2022 lab_sphinx · 2025 lab_sphinx_2025 |
| run commits | 2022 6dccba6 · 2025 084207e |
| window pairs | 50 |
| heights m | 0, 2.5, 5, 7.5, 10, 12.5, 15, 17.5, 20, 22.5, 25, 27.5, 30 |
| null shifts | 400 |
| min shift positions | 25 |
| kmz | https://raw.githubusercontent.com/BiondiProtocol/Replication-and-Verification-Biondi-Protocol/c0cb293/ICEYE_X13_Great_Sphinx_Ditch_EastWoodAvoidance_GE.kmz |
| environment | python 3.11.3 · numpy 2.4.6 · numba 0.67.0 · threads 16 · cpus 16 |
| source at | c849418 |
Across the whole Great Pyramid, the gated reconstruction’s scores are no higher inside the surveyed chambers than at the same depths elsewhere
The reconstruction’s tomograms are curtains: along each line, a score at every nominal depth below every position. P2-16 lays 95 lines across Khufu, 3 m apart, running east to west as its own east-face lines do, runs the 2022 image through its unchanged code, and stacks the curtains into a volume on a 3 m grid, with the same calculation on a motionless copy of the image beside it. The volume holds the method’s fit scores, unsmoothed, and is empty where nothing passed: it is what the method computes, not a detection and not a validated depth. Open it in the lab, under the satellite’s gated reconstruction, where it is drawn beside the surveyed chambers in blue, with its motionless copy and open plateau a click away.
What passes, and how much of the volume it fills
| positions, support 1 | support 4 | voxels with a score | |
|---|---|---|---|
| the real image | 1,355 | 4 | 135,591 |
| a motionless copy | 660 | 4 | 66,035 |
| open plateau, the same image (P2-17) | 1,059 | 0 | 105,940 |
Of 9,595 positions, those that pass at a support of one hang full depth profiles, so the volume shows columns banded every few metres, the fit’s own cycle, wherever a position passed; at the method’s own support of four almost nothing passes. The same raster laid on open plateau south-west of Menkaure, where no monument stands, passes nearly as much as the pyramid and far more than the copy: the real image’s texture, not the pyramid, sets how much passes.
Inside the surveyed chambers
If the scores located rooms, they would be higher inside the King’s and Queen’s Chambers, the Grand Gallery, the passages, the Subterranean Chamber and the ScanPyramids voids than at the same depths elsewhere. In the real image they are -0.06 on average inside and 0.04 at the same depths elsewhere; in the motionless copy -0.06 and 0.05.108 of the 519 chamber voxels hold any score in the real image. The chambers are small against a 3 m grid and the depth coordinate is nominal, so this is one check among several, stated before it was run, not a verdict on its own.
The lab’s command runs the same raster over any area of the image. Across Khafre, where the claim places its shafts, the real image passes 1,218 positions at a support of one and 0 at four, and a motionless copy of the image 539 and 0: the pattern of Khufu (1,355 and 660at a support of one) and of open plateau (1,059), where nothing is claimed. Open Khafre in the lab.
Across Khafre and Khufu, what the gated reconstruction draws does not survive a change of pass
| the same square, run two ways | positions passing | passing both | × chance | same depth | by chance |
|---|---|---|---|---|---|
| Khafre: lines laid east–west, then north–south (2022) | 1,133 · 1,158 | 719 | 4.95 | 86% | 26% |
| Khafre: the 2022 pass, then the 2025 pass (east–west) | 1,218 · 650 | 110 | 1.33 | 27% | 25% |
| Khafre, for scale: the 2022 image, then its motionless copy | 1,218 · 539 | 90 | 1.32 | 38% | 26% |
| Khufu: the 2022 pass, then the 2025 pass (east–west) | 1,355 · 593 | 83 | 0.99 | 24% | 19% |
| Khufu, for scale: the 2022 image, then its motionless copy | 1,355 · 660 | 157 | 1.68 | 45% | 20% |
Something under Khafre or Khufu would not move with the pass that looked at it or with the way the lines were laid; what the processing makes of an image would. The lab’s command ran Khafre’s square three ways and Khufu’s two (P2-41, on P2-16’s lines), each beside a motionless copy. “Same depth” is the share of positions passing both ways whose best depths lie within half the fit’s cycle, against the same pairs shuffled. A real image and its own motionless copy, which keeps only its smoothed brightness and has nothing under it, set the scale for agreement that owes nothing to what is below. In the lab, the pass and the lines are choices under the gated reconstruction, with the voxels where two runs agree.
p2_16_khufu_volumedatacode
| acquisition | giza-20220715 |
| gated module sha256 | 3e1154c11274b896b91e262198576ffd750732709ad08ac00c6892c4ea5e1b1d |
| gated profile sha256 | ae84cade31f7e5ffa9b4daa0eba152649d2afc7f1655415bad38553f4f4d69aa |
| khufu centre m | 324.3, 349.2 |
| lines | 95 |
| positions per line | 101 |
| step m | 3 |
| geoid m | 15.5 |
| supports | 1, 4 |
| twin seed | 101 |
| environment | python 3.11.3 · numpy 2.4.6 · numba 0.67.0 · threads 16 · cpus 16 |
| source at | d8a0060 |
p2_17_plateau_controldatacode
| acquisition | giza-20220715 |
| gated module sha256 | 3e1154c11274b896b91e262198576ffd750732709ad08ac00c6892c4ea5e1b1d |
| gated profile sha256 | ae84cade31f7e5ffa9b4daa0eba152649d2afc7f1655415bad38553f4f4d69aa |
| centre m | -470, -600 |
| lines | 95 |
| positions per line | 101 |
| step m | 3 |
| geoid m | 15.5 |
| supports | 1, 4 |
| environment | python 3.11.3 · numpy 2.4.6 · numba 0.67.0 · threads 16 · cpus 16 |
| source at | 96d5a6a |
lab_khafredatacode
| method | gated |
| site | giza |
| centre m | 0, 0 |
| half ew m | 150 |
| half ns m | 141 |
| step m | 3 |
| supports | 1, 4 |
| twin seed | 101 |
| product | ICEYE_X13_SLC_SLED_868226_20220715T235744.h5 |
| gated module sha256 | 3e1154c11274b896b91e262198576ffd750732709ad08ac00c6892c4ea5e1b1d |
| gated profile sha256 | ae84cade31f7e5ffa9b4daa0eba152649d2afc7f1655415bad38553f4f4d69aa |
| geoid m | 15.5 |
| environment | python 3.11.3 · numpy 2.4.6 · numba 0.67.0 · threads 16 · cpus 16 |
| source at | 4af4a3c |
p2_21_what_survivesdatacode
| runs | ew22 lab_khafre · ns22 lab_khafre_ns · ew25 lab_khafre_2025 |
| run commits | ew22 4af4a3c · ns22 c232f06 · ew25 c232f06 |
| pairs | ew22, ns22, lines, ew22, ew25, pass, ns22, ew25, both |
| cycle m | 6.17 |
| shuffles | 1,000 |
| support | 1 |
| environment | python 3.11.3 · numpy 2.4.6 · numba 0.67.0 · threads 16 · cpus 16 |
| source at | c232f06 |
lab_khufu_2025datacode
| method | gated |
| site | giza |
| centre m | 324.3, 349.2 |
| half ew m | 150 |
| half ns m | 141 |
| step m | 3 |
| supports | 1, 4 |
| twin seed | 101 |
| product | ICEYE_X33_SLC_SLEDF_951562307_20250827T202654.h5 |
| lines | ew |
| gated module sha256 | 3e1154c11274b896b91e262198576ffd750732709ad08ac00c6892c4ea5e1b1d |
| gated profile sha256 | ae84cade31f7e5ffa9b4daa0eba152649d2afc7f1655415bad38553f4f4d69aa |
| geoid m | 15.5 |
| area | Khufu |
| environment | python 3.11.3 · numpy 2.4.6 · numba 0.67.0 · threads 16 · cpus 16 |
| source at | c50a62f (with local changes to the solver at run time) |
Read the published way, a radar image did not act as a dense seismic array in our test
Every patch of an image can be read as a virtual seismometer, and there are millions of them, far denser than any real array; stacking many sensors does shrink their noise. P2-09 asks the prior question: do they hear? A test wave (60 m long, 0.15 Hz, 2 mm/s: forty thousand times Giza’s microseisms, and slow enough that neighbouring sensors move differently) is put into the simulated image itself, and 3,264 sensors are read the way the first investigation read its velocity series. Read by complex correlation, as the published trackers read them, they recover 0% of the motion under them; by magnitudes, -6%. The first investigation’s array test (R11) had added its wave to the readings after tracking, so it never asked this.



Slope -0.50 for magnitudes: independent, as hoped. But averaging deaf sensors gives a precise zero, not the motion.
How many sensors the chamber would need
| needed over the chamber, where magnitudes hear a fifth | 2 × 10¹⁹ |
| independent sensors over the chamber | 3,602 |
| in the whole image | 7 × 10⁷ |
| on all of Earth’s land | 4 × 10¹⁴ |
| needed for the ground’s whole trembling, no chamber | 8 × 10¹⁰ |
Even the trembling itself would need 1,186 times more sensors than the image holds. In the 3-D view the sensors bob with the true motion beside what each reports.
Other routes from a buried room to an X-band radar, as we estimate them, carry far too little
A radar records echoes, and an echo depends on how strongly each scatterer returns the wave and where each scatterer is while it is watched. We group the ways a buried room could reach the record into four. P2-11 estimates each, with its assumptions stated and generously to the room where we could, for the bench chamber (6 m, 15 m down), a large hall (20 m, 30 m down) and the claimed deep structure (80 m, 1,220 m down).
| Route | Best case | What it would take |
|---|---|---|
| The wave reaches the room penetration | X band gets about 30 cm into the driest sand, L band 2 m, P band 5 m; limestone conducts 50–200 times more than dry sand | the bench chamber’s roof lies at least 347 dB down at X band, the claimed structure 34,164 dB, against about 30 dB an image spans; only P band could reach a shallow room, inside its 25 m resolution cell with the surface |
| The ground moves while the image is taken vibration | the smallest motion ever measured from orbit, 0.66 mm/s on a corner reflector (2026), is 2 × 10⁸ times the chamber’s imprint | shaking of 0.6 m/s during the 25 s pass, over reflectors placed there in advance |
| The ground deforms between images interferometry under varying loads | the year’s heat wave moves the ground over the chamber by 2.4 µm; tides, air pressure and the water table 0.03–0.2 µm | 8 × 10⁵ passes at 0.5 mm each, and the ground’s own seasonal breathing (0.43 mm) is 182 times larger |
| The surface itself changes temperature, moisture | 0.1 mK at the surface | far below anything radar is known to respond to |
If these estimates hold, no processing can restore what the routes do not carry: gates, stacking, tomography and machine learning are functions of the record and cannot add to it. The estimates rest on assumptions, listed with their sources below (dry sand’s penetration as an upper bound for limestone, standard load models, a small chamber), and measurements at Giza would test them. Where radar does see underground is long wavelengths in very dry ground: the Shuttle’s L band found buried river valleys under the Sahara in 1981, and ESA’s Biomass showed ancient riverbeds under the sand of Chad in 2025. A viewer that looks underground from radar data is possible there, for the top few metres, and not from an X-band image.
Sources for the outside numbers
- Martone, Brautigam, Rizzoli, Yague-Martinez and Krieger (2014), Enhancing interferometric SAR performance over sandy areas: experience from the TanDEM-X mission, IEEE JSTARS
- McCauley et al. (1982), Subsurface valleys and geoarcheology of the eastern Sahara revealed by Shuttle radar, Science 218, 1004-1020; Paillou et al., ALOS/PALSAR over the Sahara
- ESA (23 June 2025), Biomass satellite returns striking first images of forests and more
- Davis and Annan (1989), Ground-penetrating radar for high-resolution mapping of soil and rock stratigraphy, Geophysical Prospecting 37, 531-551 (table of typical properties)
- Vattulainen et al. (2026), Assessment of spaceborne SAR micro-motion measurement for vibration-based SHM, IEEE Access 14, 6043-6064, doi:10.1109/ACCESS.2026.3652346
- Lotti et al. (2026), Monitoring bridge vibrations via spaceborne SAR micro-Doppler, Structural Control and Health Monitoring, doi:10.1155/stc/3858095
p2_11_every_way_indatacode
| rooms | id bench · name the bench chamber · size_m 6 · centre_m 15, id hall · name a large hall · size_m 20 · centre_m 30, id claim · name the claimed deep structure · size_m 80 · centre_m 1,220 |
| bands | id X · name X band (ICEYE, TerraSAR-X) · wavelength_m 0.031 · sand_penetration_m 0.3 · source martone2014 · note about 20 to 30 cm into dry desert soil; the larger value is used, id L · name L band (ALOS-2, NISAR) · wavelength_m 0.24 · sand_penetration_m 2 · source mccauley1982 · note buried river valleys seen under 1 to 2 m of sand; the larger value is used, id P · name P band (Biomass) · wavelength_m 0.69 · sand_penetration_m 5 · source esa2025 · note up to 5 m below the desert surface; used as the penetration depth itself, which is more than the observation implies |
| loss budget db | 30 |
| limestone | sigma_s_m 0.0005 · eps_r 8 |
| earthquake f hz | 2 |
| strongest pgv m s | 3 |
| smallest measured m s | 0.00066 |
| loads | tidal_strain 5e-8 · air_pa 3,000 · water_pa 10,000 · year_t_k 12 · alpha_per_k 0.000008 · kappa_m2_s 0.0000013 |
| insar mm | 0.5 |
| sigma k | 3 |
| geometry | giza-20250827 |
| environment | python 3.11.3 · numpy 2.4.6 · numba 0.67.0 · threads 16 · cpus 16 |
| source at | a32c15f |
The real pass, laid on the ground: what a viewer given radar data can honestly show
P2-12 takes the real 2025 image and puts it where it belongs: each metre of the Giza site is found in the image through the product’s own geolocation over the terrain and the pyramids, with the residual offset fitted against the brightness the surface predicts (1.0 m along the track, 2.6 m across). Each pyramid’s top lands on the ground in front of it, toward the radar, as the radar records it. The wave reaches about 30 cm into dry sand at most. Run on this image, the published method draws its columns wherever the registration wanders (its power follows each pixel’s trajectory energy at 1.0000). Every patch draws columns: the pyramids, whose surfaces are busier, draw more of the strongest (5–9% of their pixels are among the noisiest 5%, against 1.6–3.6% on open plateau), while their typical pixel wanders as much as open plateau’s. A pyramid’s picture differs from open plateau’s (0.61–0.83) by no more than two stretches of open plateau differ from each other (0.44–0.72).
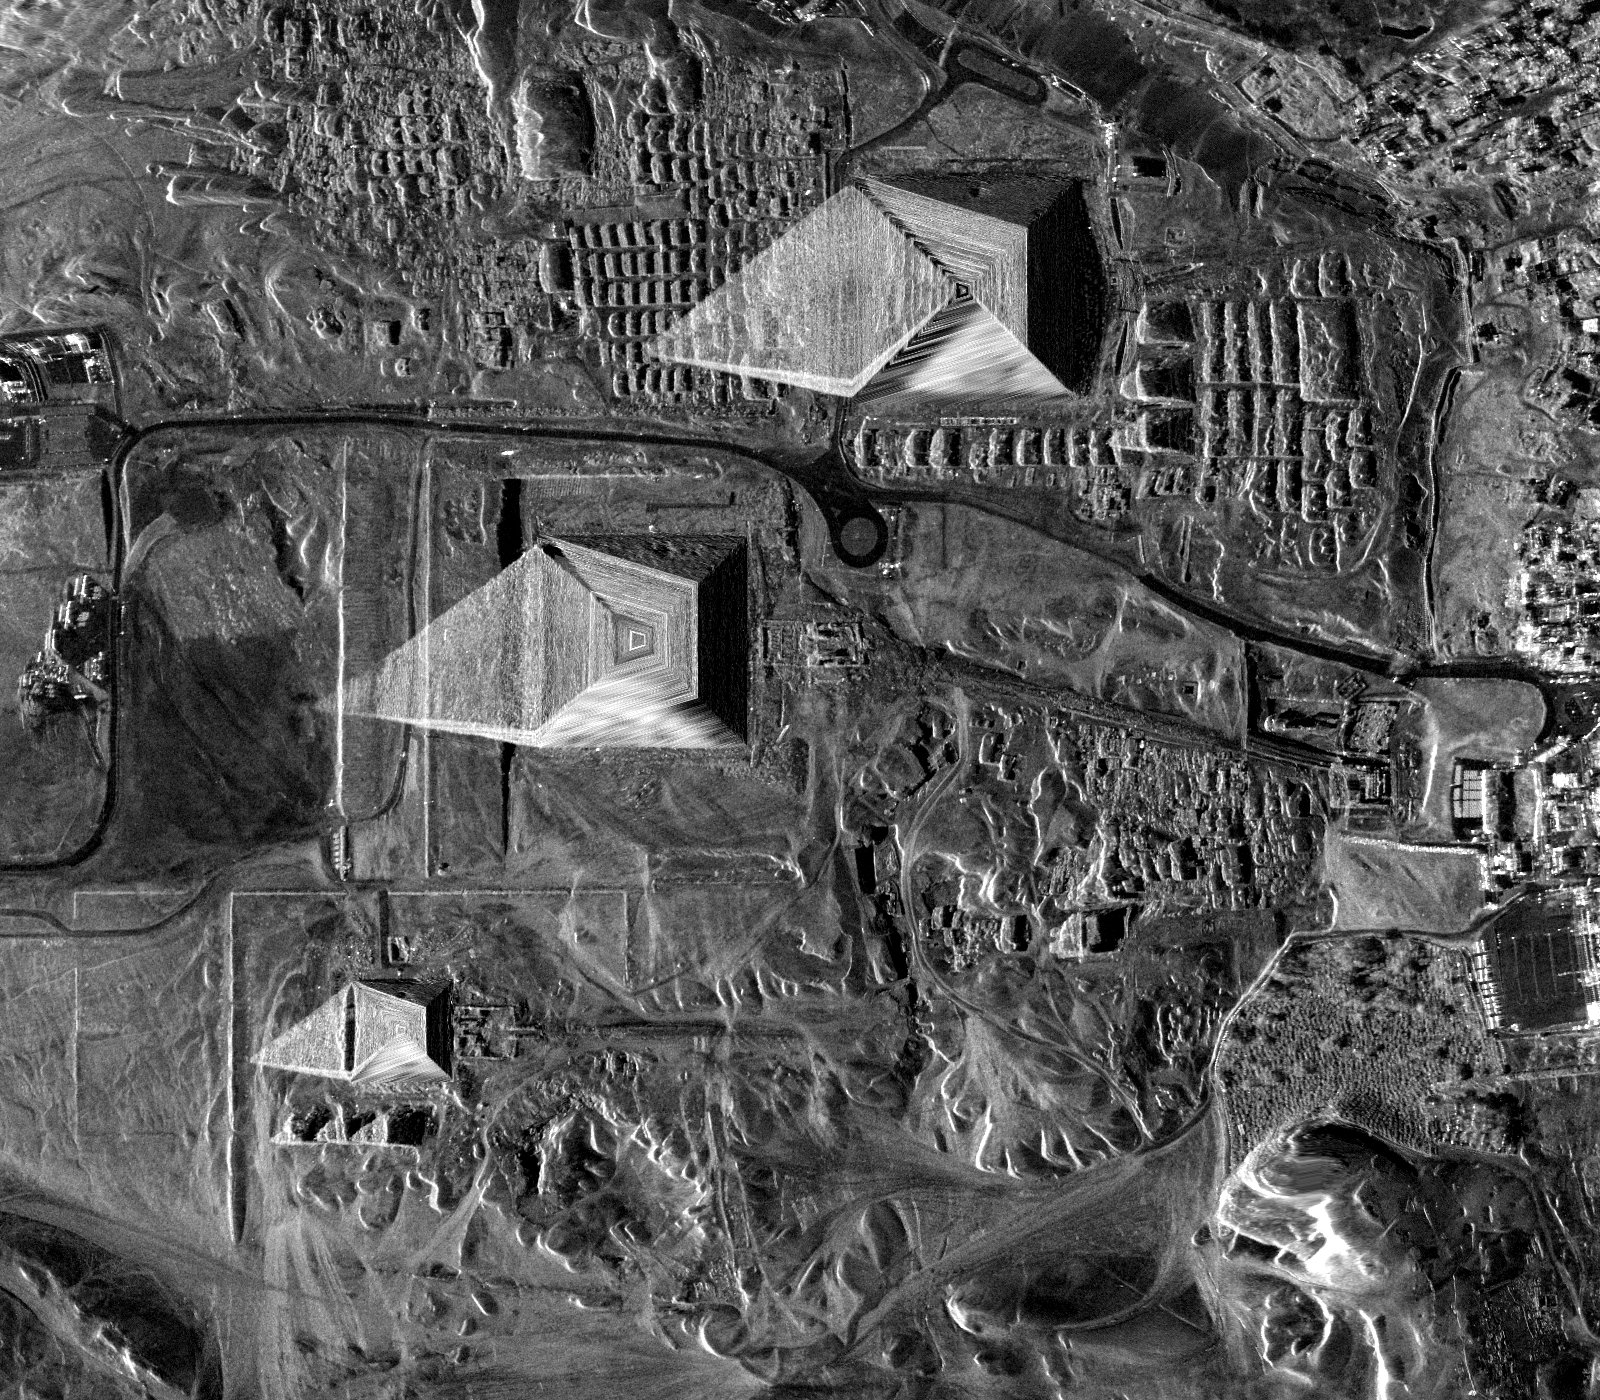
In the 3-D view
Giza in the lab, looked at with the satellite, shows the pass over the plateau, this image draped on the terrain, and the paper-style pipeline’s volume at Khafre, Khufu, Menkaure and open plateau, side by side with the chambers surveyed inside the pyramids.
The same steps take any product: its geolocation and orbit give the pass and the image on the ground, and its band gives the reach. For X band that reach is a skin; long wavelengths over dry sand reach a few metres, which is where a radar image can show something underground.
p2_12_real_passdatacode
| acquisition | giza-20250827 |
| site | giza |
| geoid m | 15.5 |
| ortho m | 1 |
| registration m | 2 |
| patches | khafre, monument, khufu, monument, menkaure, monument, plateau_south, control, desert_west, control, desert_south, control |
| bank | paper (K 50, half band, 88 Hz, 32 px, lambda_s 0.48 m) |
| claim repeat m | 648 |
| voxel m | 5 |
| environment | python 3.11.3 · numpy 2.4.6 · numba 0.67.0 · threads 16 · cpus 16 |
| source at | 02c7253 |
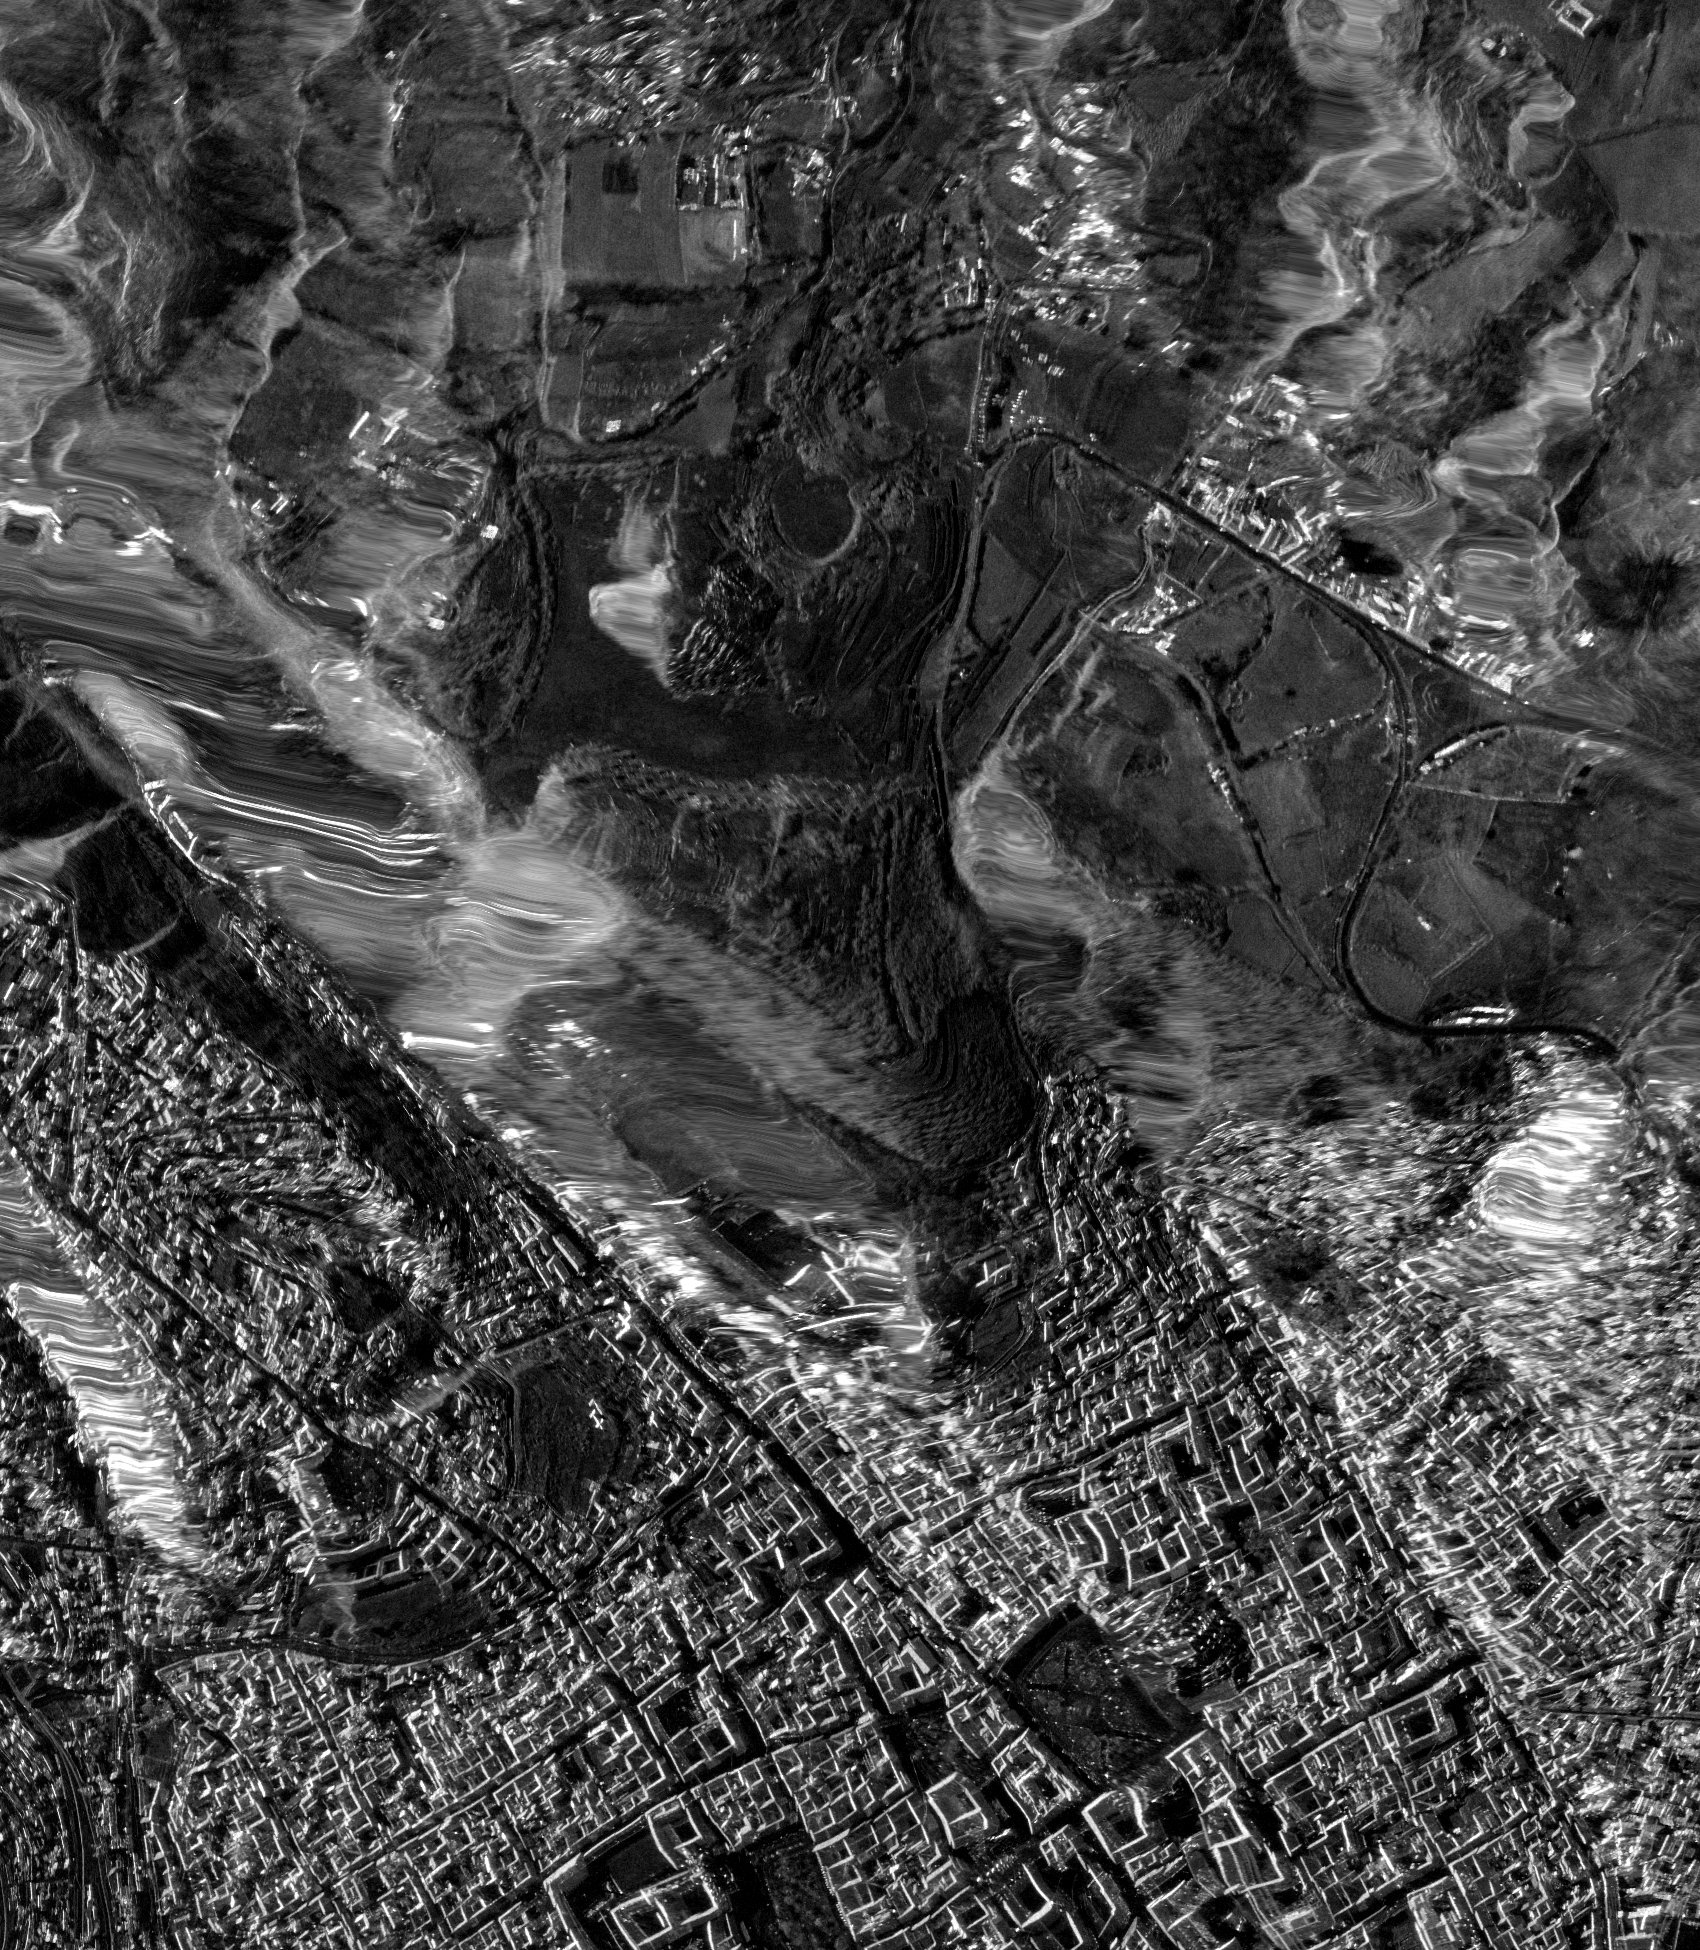
At Sacsayhuamán the houses draw alike and the walls apart, from what the image holds of the surface
A second pass (ICEYE X35, 22 August 2025), laid on its terrain within 10 m along the track and 12 m across, and six areas chosen on it before the method ran: the zigzag walls, the Rodadero outcrop, open fields and three stretches of houses. The houses draw alike (depth profiles correlating at 0.98–1.00) and take the strongest columns (8–12% of their pixels among the noisiest 5%, against 0% of the monuments’); the walls draw apart (0.84–0.89 with houses and fields), the Rodadero close to the houses (0.93–0.97).
Motionless copies of the six areas, each area’s brightness pattern with nothing moving, keep neither the shared profile nor the walls’ difference (they correlate with the real ones at -0.05–0.41): both come from something the real image holds beyond its brightness pattern, and not from below the surface, which X band reaches no further into than about 30 cm. The gated reconstruction, run unchanged, passes 1,126 of 9,595 positions over the fields north of the site (its motionless copy 657); 2,411 of 9,595 positions over the city grid houses (its motionless copy 1,743); 463 of 9,595 positions over the zigzag walls (its motionless copy 293) at a support of one.
Sacsayhuamán in the lab: the pass, the image on the terrain and each method’s pictures, area by area.
p2_33_sacsayhuamandatacode
| acquisition | sacsayhuaman-20250822 |
| site | sacsayhuaman |
| geoid m | 46.2 |
| ortho m | 1 |
| registration m | 2 |
| areas | key walls · label Zigzag walls · x 14.6 · y -92.7 · kind monument · placed the midpoint of the walls' OpenStreetMap outline (ways 431479258 and 431479257); Muyuqmarka behind them, key rodadero · label Rodadero outcrop · x 40 · y 110 · kind monument · placed the carved outcrop across the esplanade (OpenStreetMap node 5857164644 and its bare-rock outline), clear of the walls' area, key fields · label Fields north of the site · x -100 · y 525 · kind control · placed dark, flat fields on the laid image, clear of buildings, key san_cristobal · label San Cristóbal houses · x 300 · y -650 · kind houses · placed houses on the slope below the walls, on the laid image, key san_blas · label San Blas houses · x 820 · y -830 · kind houses · placed houses round the San Blas quarter (OpenStreetMap way 23799145), on the laid image, key grid · label City grid houses · x -250 · y -1,000 · kind houses · placed the flat street grid west of the Plaza de Armas, on the laid image |
| patch px | 4,096, 768 |
| bank | paper (K 50, half band, 88 Hz, 32 px, lambda_s 0.48 m) |
| claim repeat m | 648 |
| voxel m | 5 |
| environment | python 3.11.3 · numpy 2.4.6 · numba 0.67.0 · threads 16 · cpus 16 |
| source at | d13b0ca |
What could change the answer, and where each stands
More motion
Peterson’s high-noise model, 71 times Giza’s microseisms, leaves the plateau short by 10⁷. Traffic exceeds 77 µm/s within 25 m of a road (P2-00), but at 10–30 Hz, where a look must be under 33 ms and resolves 33 m; short by 10⁴ on ground. Khafre is 199 m from the nearest road.
Brighter targets
Magnitude tracking follows an isolated bright scatterer in full (P2-03), so the best case is a stone or a placed corner reflector above the chamber: short by 10⁷ and 10⁶ under Giza’s microseisms, 10⁴ for the reflector at the noisiest stations.
Other structures
The imprint scales as volume over depth squared (checked against the solver, P2-04); the claimed deep structure scales to 0.36 of the bench chamber. Independently of any structure, Giza’s whole microseism motion is 18,365 times below the plateau’s detection threshold.
A better estimator
Bounded for all of them at once (above, P2-25). Under the textbook model of ordinary ground, fully developed speckle, a phase history shared by a patch leaves the image’s distribution unchanged; what survives is the texture’s stretch along track, and within that model no estimator, test or learned model can raise its detection rate above its false-alarm rate by more than 1.3 × 10⁻⁹ on the bench chamber under Giza’s regional microseism level. On small test images the best test gets within 1.4 times of the bound. Bright points are bounded separately (2.4 × 10⁻⁷ for a corner reflector over the chamber), and a method told the ground’s reflectivity, which no single image has, does no better than 5.0 × 10⁻⁷.
Stricter selection
Gates can only discard readings, never add what the image does not hold. Run unchanged on the real image, a gated version passes motionless copies of it too, passes nothing at its own settings on its own lines, and cannot pass a vibration’s own trace at any strength (above).
The published images
The pipeline draws structured sections from any input: identical with and without the chamber (P2-07), the same over monuments and open desert (R1, R6), no signal over hundreds of surveyed shafts (R13), and, with settings the paper does not state, the published rungs and blocks (P2-35).
Vibration measured from orbit, 2026
The method’s authors first applied this kind of tracking to bridges in Italy and to the Mosul Dam in 2020, without instruments on the structures at the same time. Two 2026 papers (Vattulainen et al., IEEE Access; Lotti et al., Structural Control and Health Monitoring) measure vibration from single spaceborne images against ground truth: corner reflectors on shakers in open fields, and a steel footbridge chosen because it is bright. They track isolated bright targets moving at 0.7 mm/s and up, with errors near 1 mm/s: what P2-03 says works. Their smallest motion is 13,469 times Giza’s whole microseism motion and 2 × 10⁸ times the chamber’s imprint.
Only simulation?
The coherence identity holds on the real crop to 10−9; the blindness is measured on real texture (1 ± 1%); the geometry is read from the product and reproduces its declared numbers; and the first investigation’s real-data controls found nothing at Giza or Sacsayhuamán.
What this corrects, in the first investigation and in this lab’s own later work, and what still stands
We presented impossibility more broadly than the work supports
Earlier versions of this page said one image “cannot” find a chamber and that every route was “closed”. The work shows that the methods tested do not establish subsurface imaging, that their depth axis is a frequency axis, and that the routes we modelled carry far too little. It does not prove every conceivable route impossible.
We first ran the stricter reconstruction on the wrong lines
Its “70.5 m” is Khafre’s base height above sea level; we read it as a height above the base and drew loops up the faces (P2-13). Its own base lines, as sent and corrected for the geoid, are run in P2-14, with their hashes.
We gave the Sphinx line’s pixel as 15 cm across, and compared the author’s earlier line by index
15 cm is the 2025 product’s slant-range sample, typed by hand; on the 2022 pass the line uses, a pixel is 44 cm across on the ground, now read from the product (P2-39). The earlier line is shorter than the published one, so its positions do not stand at the same places; we first counted shared positions by index and wrote that it kept none. Compared by place, 1 of the columns beside it has one of its own within a position.
We quoted a boxcar as the registration’s response
sinc(fT) is the response of a rectangular average. Measured through the reconstruction’s own masks and registration (P2-15), a vibrating point’s images move by 0.06 to 45 times the boxcar value, depending on frequency; the near-nulls we claimed at two of its modes are not established.
We stated the shared-spectrum identity too broadly
It is exact for whole images with real, non-negative masks. Patch registration mixes frequencies, so there it is a strong pull toward zero that has to be measured, not a proof.
We gave a significance to depth following the mode
We wrote “89% against 3% by chance”. After the gates keep sinusoids, depth following the mode is what the depth fit computes, not a test, and neighbouring positions are not independent findings.
We leaned on two twins and one stretch of desert
They are stress tests: they show the selected pattern arises without motion or anything inside under that generator. They do not measure how often it arises over real ground, and open desert is not surveyed ground.
The coherence curve measured the looks, not the ground
Its 0.98 s to half and 1.76 s to a tenth are 1 − Δ/W for its 1.96 s looks, reproduced by simulated desert with no decorrelation and by the real crop’s own spectrum. How stable the ground is across a dwell has not been measured.
The 77 µm/s floor is noise, not sensitivity
It is the scatter of a complex registration that recovers 1% of real ground’s motion. On bright point targets a magnitude tracker does follow motion, with a scatter of the same order.
The injected motion never came back
Its recovery gains sit near zero at every amplitude up to 1 cm, as expected of motion common to a whole crop of speckle. Its later frequencies, 1, 2 and 3 Hz, sit on the nulls of its looks.
Bright pixels were graded with the same identity
Complex coherence between one image’s looks is set by the spectrum whatever the pixels are. A lone bright scatterer’s envelope in fact follows its motion across the dwell.
Hundreds of surveyed burial shafts give no signal at their depths
Over the Eastern and Western Cemeteries, shafts 5 to 30 m deep, the depth profiles match bare plateau, before and after matching surface brightness.
The depth axis is set by the processing, and resolution by the look
The published axis folds within metres and repeats by an algebraic identity (P2-06 gives it a frequency); a look short enough to follow a wave through the ground resolves tens of metres at best.